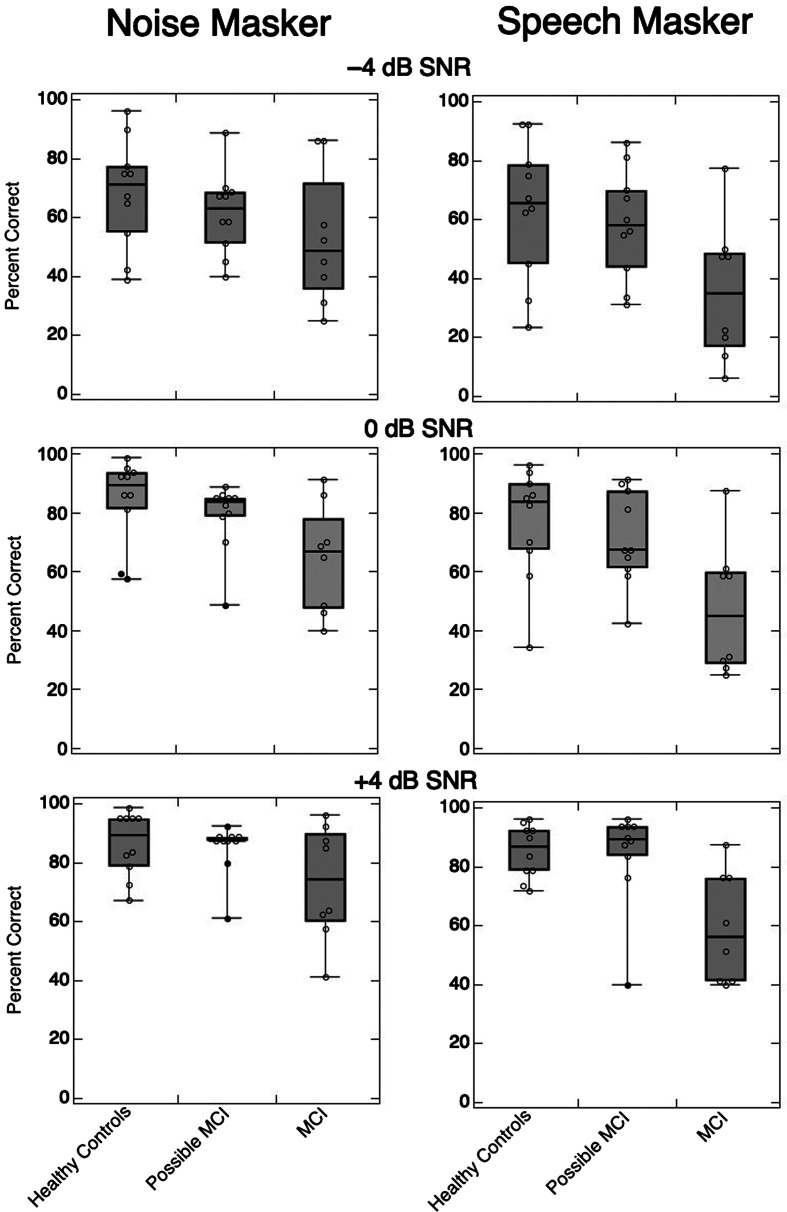
Figure 2.
Box and whisker plots for all speech-in-noise conditions per experimental group: healthy controls, possible mild cognitive impairment (MCI), and MCI/dementia. Max and min of the boxes represent the 75th and 25th quartiles, respectively; the midline of the box is the median. The max and min caps on the whiskers represent the max and min datapoints. Each individual datapoint is shown as an unfilled circle; filled circles represent outlier data (per Tukey’s method).

