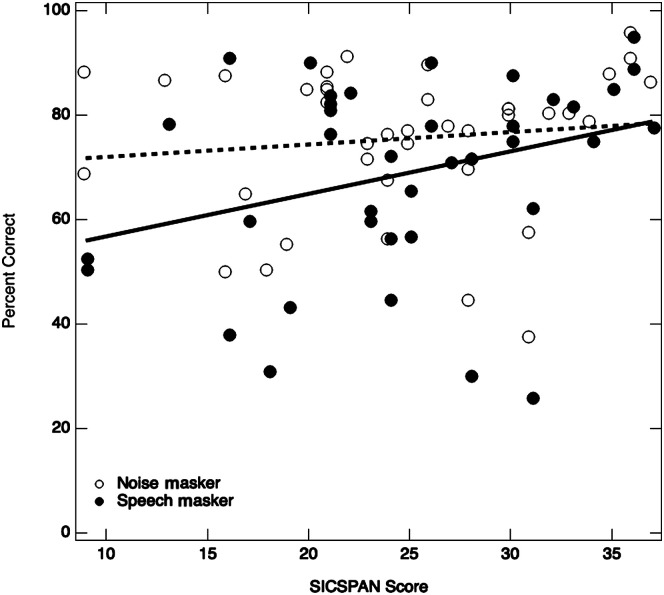
Figure 3.
Scatter plot data for all participants (n = 39) as a function of Size Comparison Span (SICSPAN) score. The averaged performance across all signal-to-noise ratio conditions is plotted for each participant in each noise type. The open circles show percent correct in the noise masker, and the solid circles show percent correct in the speech masker. The dotted line reflects the correlation between performance in the noise masker and SICSPAN score, and the solid line reflects the correlation between performance in the speech masker and SICSPAN score.

