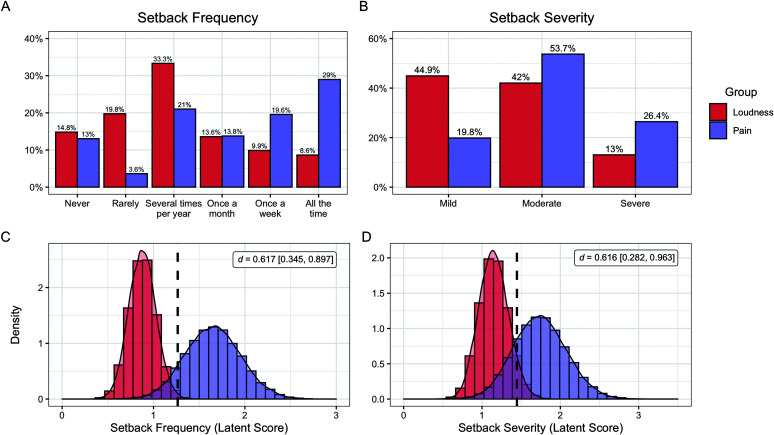
Figure 1.
Comparison of setback frequency and severity between patients with loudness and pain hyperacusis. Percentages of individuals in each group endorsing each response on the Coordination of Rare Diseases at Sanford survey regarding (A) setback frequency and (B) setback severity. Ordered probit models were used to compare latent mean scores between groups, and the posterior distributions of latent mean scores are depicted for (C) setback frequency and (B) setback severity. Vertical dotted lines indicate the grand mean score of the sample on each variable.

