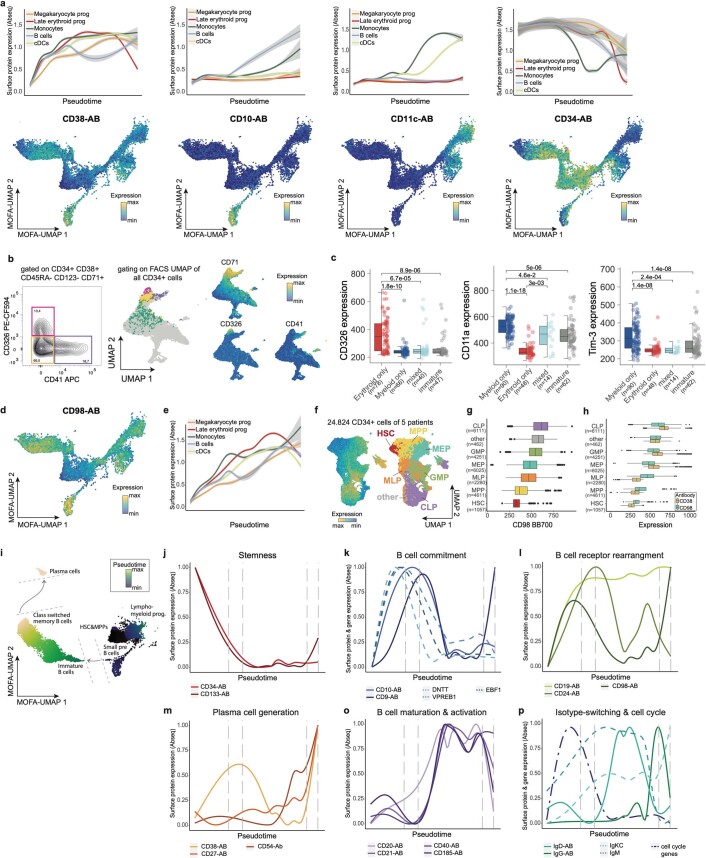
Extended Data Fig. 6. Surface markers associated with HSC and B cell differentiation.
Related to Figs. 2 and 3. See methods, section Data visualization for a definition of boxplot elements. a. Top: Line of surface protein expression smoothened over pseudotime (see Fig. 3a). Error ribbon indicates 95% confidence interval from the smoothing GAM model. Bottom: UMAP display of marker expression in CD34 + HSPCs. b. Left: Gating strategy for subsetting CD71 + erythroid/megakaryocytic HSPCs into CD41 + megakaryocyte and CD326 + erythroid progenitors. Right: UMAP display of flow cytometric data from CD34 + cells from a healthy donor analyzed with a 12-color FACS panel for erythroid/megakaryocytic differentiation (Supplementary Table 6). Feature plots of CD71, CD326 and CD41 expression highlight the bifurcation within CD71 + HSPCs. c. Culture outcome categories described in Fig. 3g were analyzed with regards to their CD326, CD11a or Tim3 surface expression. A two-sided Wilcoxon rank sum test was used for comparison of individual groups and significance levels between groups. P-values were adjusted for multiple comparisons using the Holm method. d, e. Like Fig. 3d, e, except that CD98 expression is shown. f. UMAP display of flow cytometric data from CD34 + cells from five healthy donors analyzed with a 12-color FACS stem and progenitor panel (Supplementary Table 6). Left: shows CD98 surface expression, right panel shows assignment of individual gates to the UMAP according, as follows: HSC: CD34 + CD38-CD45RA-CD90 + ; MPP: CD34 + CD38-CD45RA-CD90-; MLP: CD34 + CD38-CD45RA + ; MEP: CD34 + CD38 + CD10-CD45RA-; GMP: CD34 + CD38 + CD10-CD45RA + ; CLP: CD34 + CD38 + CD10 + CD45RA + . g. Boxplots showing CD98 expression in individual cell populations mentioned in f. h. Boxplots showing co-expression of CD98 and CD38 markers. i. Like Fig. 3a, UMAP depicting the pseudotime score along the B cell differentiation trajectory emanating from CD34 + HSCs & MPPs and Lymphomyeloid progenitors. j–p. Line plots depicting surface expression representative for different biological processes smoothened over the B cell pseudotime trajectory.

