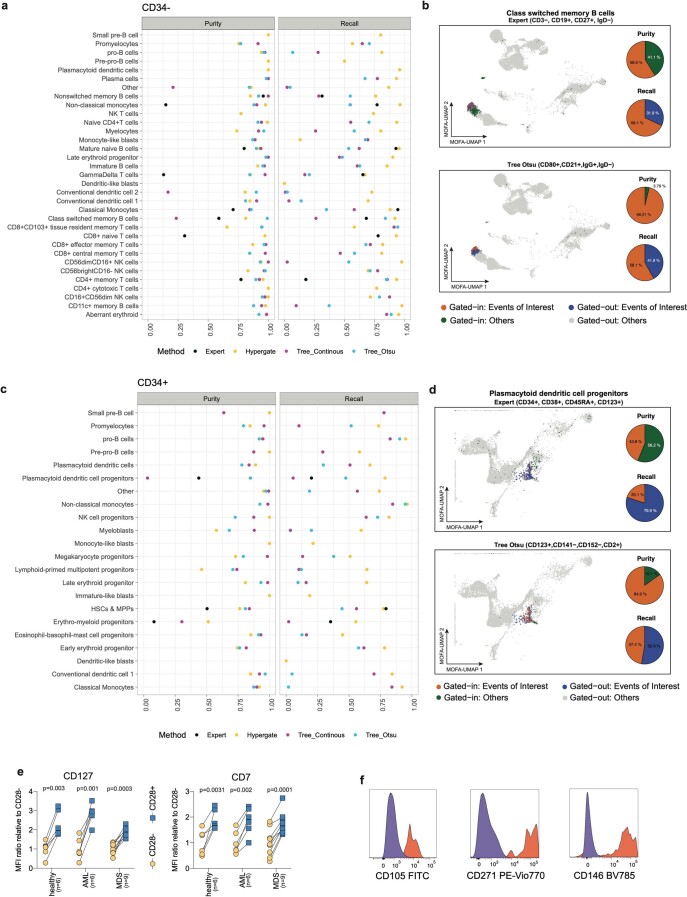
Extended Data Fig. 8. Comparison of data-defined and state-of-the-art (expert-defined) gating schemes.
Related to Fig. 5. a. Performance of different methods for the definition of gates of CD34- populations. Gates for each cell type were defined from CD34- Abseq data as follows: Black dots correspond to gates identified from literature (Supplementary Table 5). Yellow dots correspond to gates that were set using the hypergate algorithm (Becht et al., 2019). Light blue and violet dots correspond to gates that were set using a decision tree with or without predefined thresholds, respectively. See also Methods. For each gating scheme, precision (purity) and recall were calculated. b. Automated and expert-defined gates of class switched memory B cells. Orange and blue dots on the UMAP correspond to class switched memory B cells located within and outside of the selected gate, respectively (that is true positives and false negatives). Green and gray dots correspond to other cells located inside and outside the gate, respectively (that is false positives and true negatives). Pie charts indicate precision and recall. Top: Shows an expert-defined state of the art gating scheme (CD3-CD19 + CD27 + IgD-). Bottom: Shows a data-defined gating scheme (CD80 + CD21 + IgG+IgD-). c. Like a, except that CD34 + populations are shown. d. Like b, except that gating schemes to define pDC progenitors are shown. e. Paired scatter plot depicting the mean fluorescence intensities (MFI) of CD127 and CD7 in CD4 + CD28- cytotoxic CD4 + T cells (yellow) and CD4 + CD28 + other CD4 + T cells (blue) in BM samples from healthy, AML and MDS patients. n = 6, 6 and 9 patients in the respective groups. f. Representative FACS histograms showing surface expression of well-known MSC surface markers. No significance = ns, P < 0.05 *, P < 0.01 **, P < 0.001 ***, P < 0.0001 ****. CD4 + CD28- and CD4 + CD28 + paired cell populations within the same BM donors from different disease entities were compared using paired two-tailed t-test. P-values were adjusted for multiple comparisons using the Bonferroni method.

