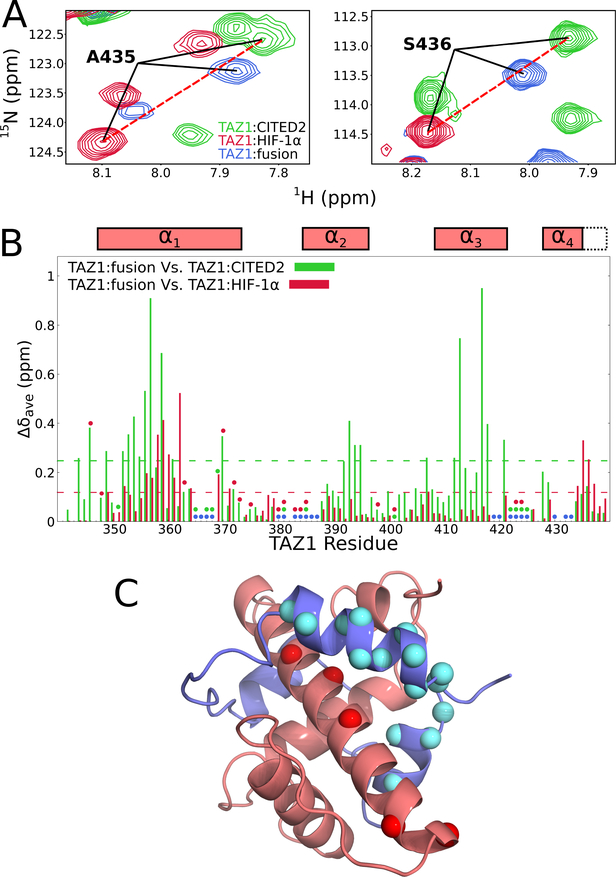
Figure 3. Comparison of 1H-15N HSQC spectra of 15N-labeled TAZ1 in complex with CITED2, HIF-1α, and the fusion peptide.
(A) Regions of superimposed 1H-15N HSQC spectra (900 MHz 1H frequency) of 15N-labeled TAZ1 bound to unlabeled CITED2 (green), HIF-1α (red), or fusion peptide (blue). Backbone amide cross peaks corresponding to TAZ1 α4 helix residues A435 (left panel) and S436 (right panel) are labeled. (B) Weighted average 1H,15N chemical shift differences for 15N-TAZ1 (Δδave=[(ΔδHN)2+(ΔδN/5)2]½) between the CITED2 and fusion peptide complexes (green) and between the HIF-1α and fusion peptide complexes (red). Circles denote residues for which backbone amide resonance assignments are missing for the CITED2 (green), HIF-1α (red), and fusion peptide (blue) complexes. Residues for which there are no circles and no data are prolines. Boxes above the plot indicate the positions of the TAZ1 α1 − α4 helices in the TAZ1:fusion peptide crystal structure; the broken lines indicate the length of the α4 helix in the TAZ1:CITED2 structure. The broken green and red lines inside the graph denote one standard deviation above the 10 % trimmed mean for the TAZ1:CITED2 Vs. TAZ1:fusion peptide and TAZ1:HIF-1α Vs. TAZ1:fusion peptide data sets, respectively. (C) Structure of the TAZ1:fusion peptide complex, with TAZ1 shown in salmon and the fusion peptide in slate. TAZ1 α1 residues for which backbone amide 1H-15N HSQC cross peak intensity is reduced by greater than 60 % in the fusion peptide complex compared to the CITED2 complex are shown as red spheres. Fusion peptide αA and αC residues for which backbone amide resonances are broadened beyond detection or have normalized cross peak intensity less than 0.2 (see Figure 4B) are shown as cyan spheres. Zn atoms are omitted for clarity.

