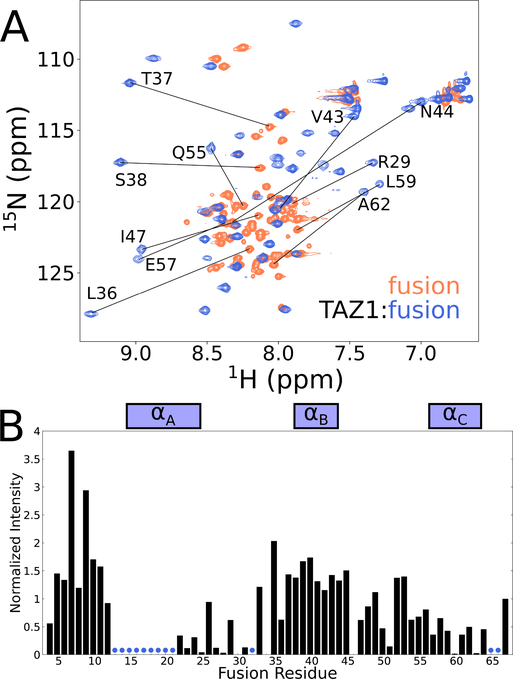
Figure 4. Solution NMR characterization of the fusion peptide.
(A) Superimposed 900 MHz 1H-15N HSQC spectra of 15N-labeled fusion peptide bound to unlabeled TAZ1 (blue) and free in solution (coral). Representative amide cross peaks that undergo large shifts in position upon complex formation are labeled. (B) Intensities of backbone amide cross peaks from 1H-15N HSQC spectra of 15N-labeled fusion peptide in complex with unlabeled TAZ1. Intensities are normalized to the intensity of the backbone amide cross peak of the C-terminal fusion peptide residue (N67). Boxes above the plot indicate the positions of the CITED2 αA and HIF1α αB and αC binding motifs. Residues for which backbone amide cross peaks are broadened beyond detection are denoted by blue circles.

