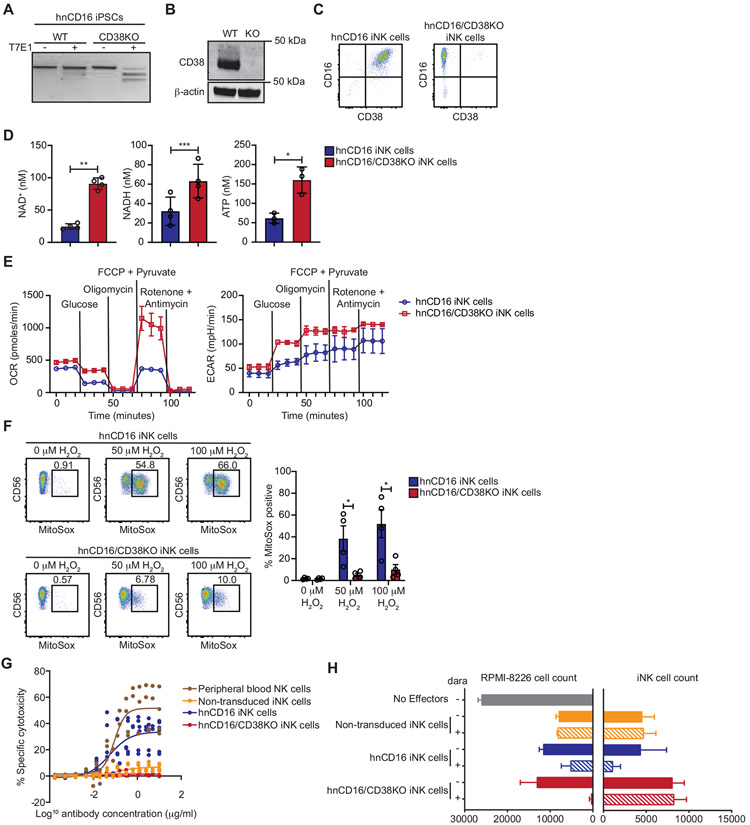
Figure 2. hnCD16/CD38KO iNK cells exhibit enhanced metabolic fitness and avoid daratumumab-mediate fratricide.
CRISPR-Cas9 was used to knock out CD38 in iPSCs with transgenic expression of hnCD16. Knockout efficiency was assessed using (A) a T7E1 nuclease assay, (B) Western blot, and (C) flow cytometry. (D) The concentrations of NAD+ and NADH were determined in hnCD16 iNK cells and hnCD16/CD38KO iNK cells using a calorimetric cyclase assay, and ATP concentrations were determined by bioluminescence. Statistical significance was determined by paired Student’s t-test, and results are from 2 independent experiments. *p < 0.05, **p < 0.01, ***p < 0.001 (E) Real time metabolic profiling of hnCD16 iNK cells and hnCD16/CD38KO iNK cells was performed by Seahorse analysis. Shown are the oxygen consumption rates (OCR) and extracellular acidification rates (ECAR) for 1 of 4 experiments performed. (F) hnCD16 iNK cells and hnCD16/CD38KO iNK cells were cultured in media alone or the indicated concentrations of H2O2 for 1 hour. Levels of mitochondrial superoxide were assessed by MitoSox dye fluorescence. Shown are FACS plots for a representative experiment (left) and cumulative data from 3 independent experiments. Statistical significance was determined by paired Student’s t-test. *p < 0.05 (G) To evaluate daratumumab-induced fratricide, iNK cells and peripheral blood NK cells were cultured with increasing concentrations of daratumumab for 3 hours, and viability was assessed by flow cytometry with staining for 7-AAD and a fixable viability dye. Data is graphed as specific cytotoxicity (% specific death - % spontaneous death) / (1 - % spontaneous death) x 100. Results were compiled from 2 independent experiments. (H) In 3D tumor killing assays, RPMI-8826 cells were cultured in low binding plates for 2 days to form tumor spheroids. The indicated iNK cells were then added at a 2:1 ratio with or without daratumumab. After 5 days, cultures were disrupted, and the remaining viable tumor and iNK cell numbers were quantified by flow cytometry. Results are representative of 2 independent experiments. Data are represented as mean ± SEM.

