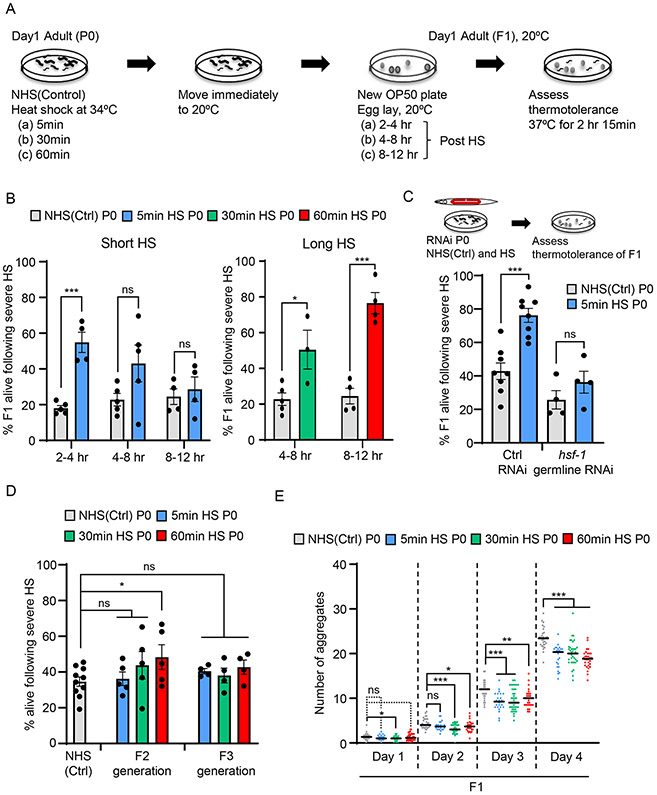
Figure 1: HSF-1 germline activity alters the stress resilience and proteostasis mechanisms of progeny that develop from stressed germ cells.
(A) Experimental procedure (also see STAR Methods).
(B) Stress resilience of F1 progeny of C. elegans mothers subjected to a short (5-minute) or long (30-minute or 60-minute) heat-shock (HS).. X-axis: the time interval at 20°C after the maternal heat-shock at which progeny were collected. Non-heat shocked control: NHS(Ctrl). Y axis: Percent F1 progeny surviving severe heat-stress. Legend: duration of maternal heat-shock. n=3-6 experiments/time point. Each experiment represents 3-20 P0 mothers/condition/time interval and an average of 24.3±2.3 F1 progeny/time interval/experiment for the short heat-shock experiments and 50.4±7.8 F1 progeny/time interval/experiment for long heat-shock experiments.
(C) Stress resilience of F1 progeny of NHS(Ctrl), and 5-minute heat-shocked P0 mothers, following hsf-1 germline RNAi. Control (Ctrl) RNAi: L4440 empty vector. n=4-8 experiments, 27.4±0.8 and 23.4±2.7 F1 progeny/experiment on L4440 and hsf-1 RNAi respectively.
(D) Stress resilience of F2 and F3 progeny of NHS(Ctrl) and heat-shocked P0 mothers. Heat-shock: 5-minute, 30-minute and 60-minute. Y axis: Percent NHS(Ctrl), F2 and F3 progeny that surive severe heat-stress. Legend indicates duration of maternal heat-shock. Each experiment represents 3-20 P0 mothers/condition and F2 and F3s collected from 5-40 F1 or F2 progeny/condition.
(E) Number of polyglutamine aggregates in day-one to day-four adult F1 progeny of NHS(Ctrl) and heat-shocked P0 mothers. Heat-shock: 5-minute, 30-minute or 60-minute. n=3 experiments, 25 F1 progeny/experiment from 3-20 P0 mothers/condition.
B-E: Data show Mean ± Standard Error of the Mean. *: p<0.05, **: p<0.01, ***: p<0.001, ns: non-significant; Unpaired Student’s t-test.
See also Figures S1 and S2

