
Figure 1. Functional and structural characterization of GluA2-γ5.
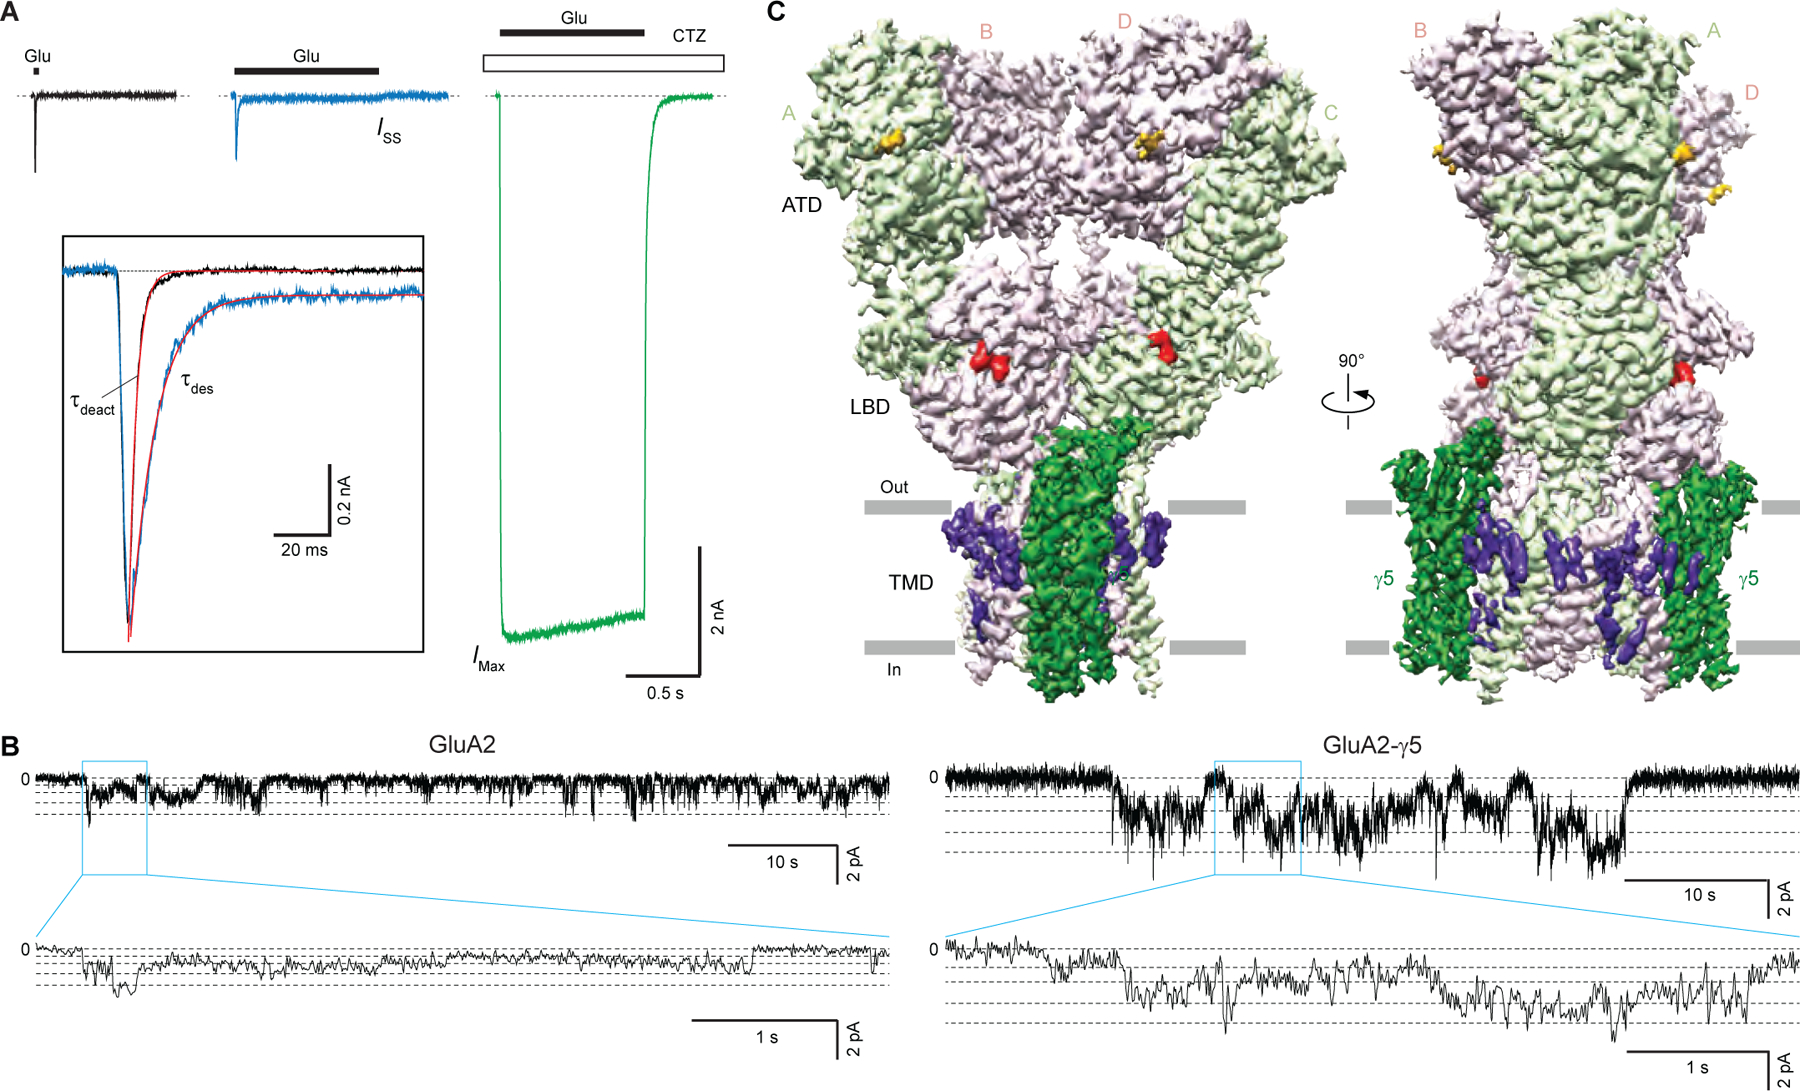
(A) Representative whole-cell currents recorded at −60 mV membrane potential from HEK 293 cell expressing GluA2-γ5 in response to 2-ms (black) or 1-s (blue) applications of 3 mM Glu alone or application of Glu in the continuous presence of 30 μM CTZ (green). The inset shows normalized currents in response to 2-ms and 1-s applications of Glu alone fitted using single exponentials (red curves).
(B) Representative single-channel currents recorded at −100 mV potential in the continuous presence of 10 mM Glu and 100 μM CTZ from GluA2 (left) and GluA2-γ5 (right) reconstituted into lipid bilayers (upper traces), with expanded views of the regions indicated by the blue boxes (lower trace). Horizontal dashed lines indicate different conductance levels.
(C) 3D cryo-EM reconstruction of GluA2-γ5, with density for GluA2 subunits colored in light green and pink, γ5 in dark green, lipids in purple, antagonist ZK200775 in red, and carbohydrates in orange.
See also Figures S1 and S3, Table S1.