
Fig. 1. Maximal response to therapy by mutation status in patients with NSCLC.
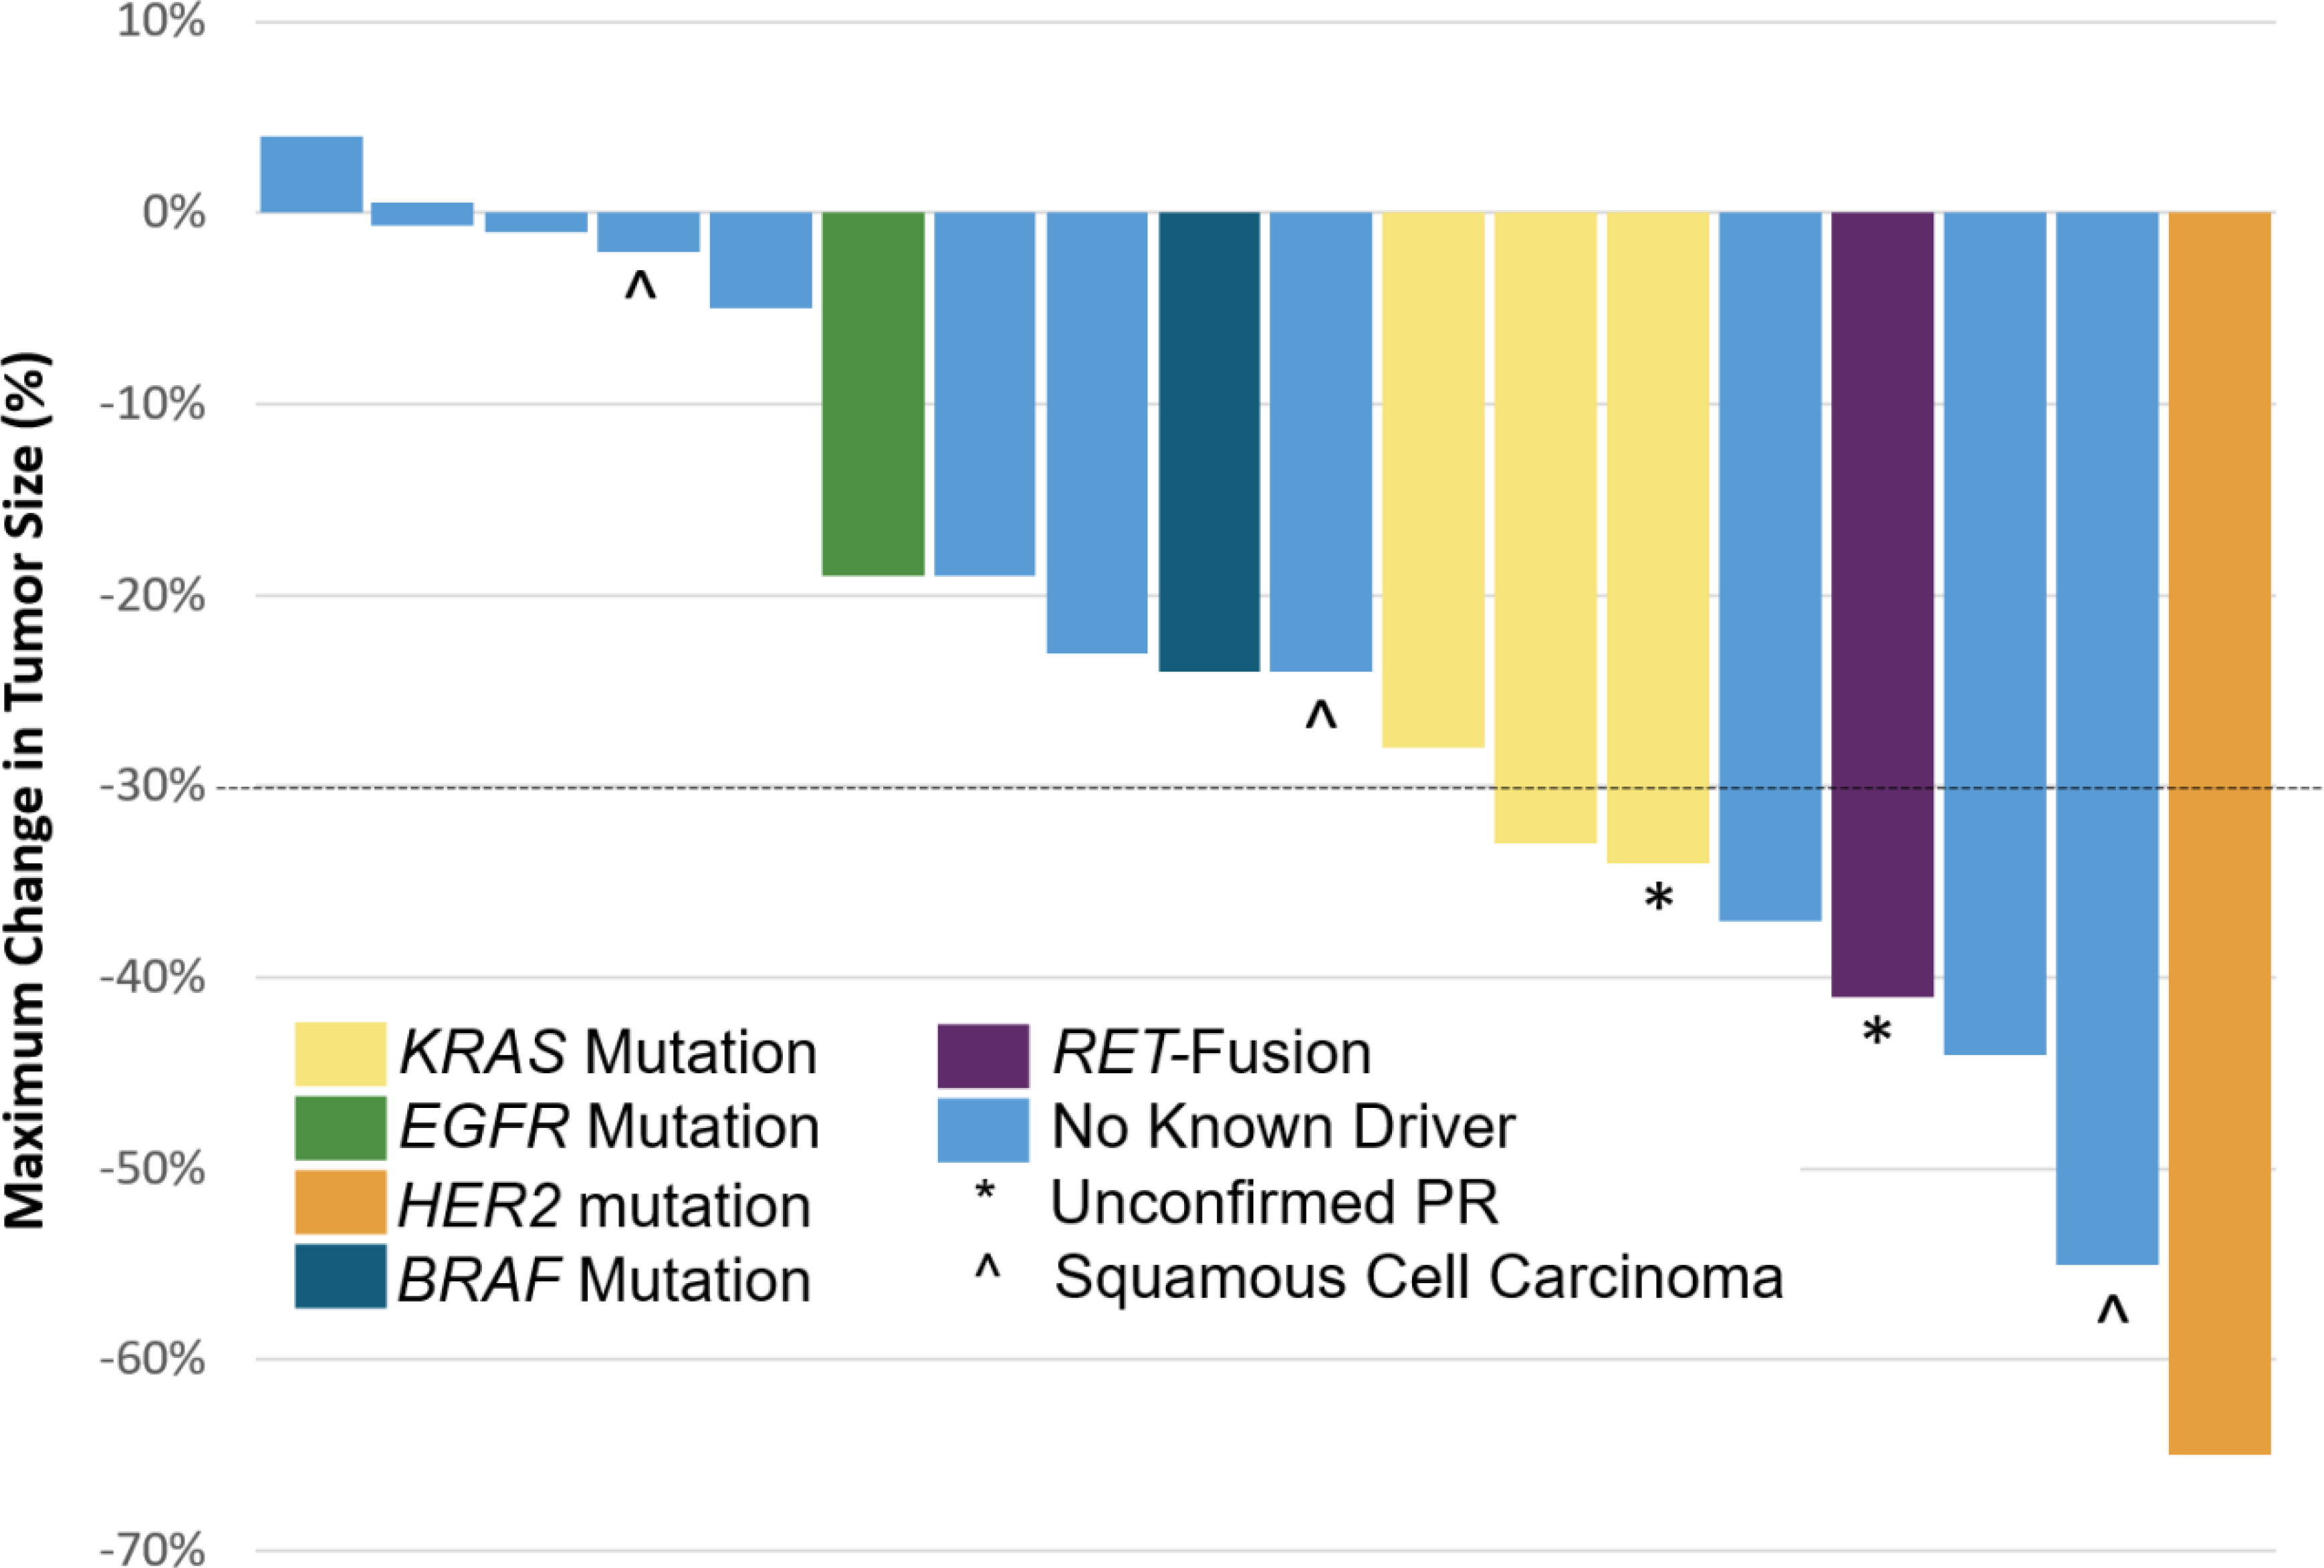
Waterfall plot showing the maximal change in tumor size. The color of the bar represents the mutation type as shown. Unconfirmed partial responses and patients with squamous cell carcinoma are also indicated. A dashed black horizontal line is shown at −30%, the threshold for a partial response.