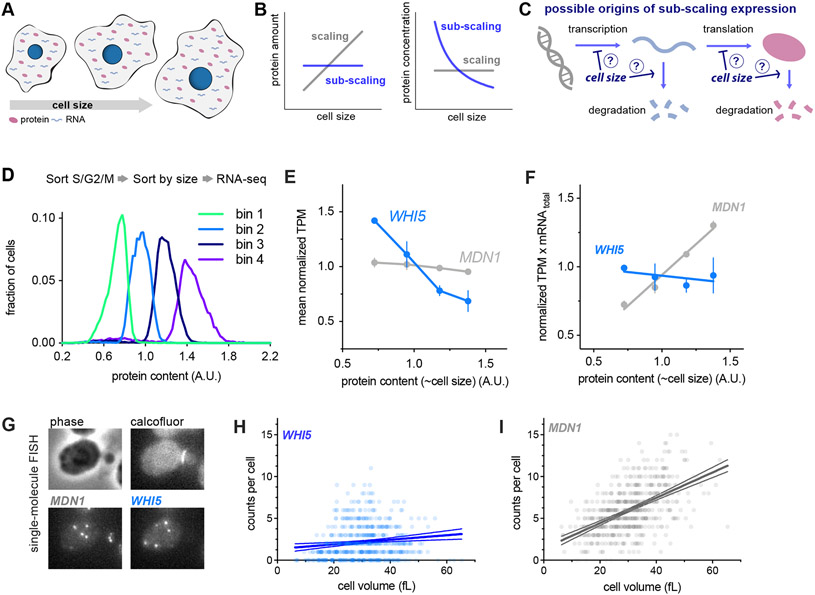
Figure 1 ∣. WHI5 mRNA does not scale with cell size.
See also Figures S1&S3.
(A-C) Schematics illustrating scaling and sub-scaling gene expression. (A) Total protein and RNA copy numbers per cell generally scale with to cell volume so that concentrations remain constant during growth. (B) However, some proteins sub-scale with size such that protein amounts are constant as a function of size and therefore protein concentrations decrease with cell size, which (C) could result from regulation at any step of gene expression.
(D-F) Cells in S/G2/M were sorted into four bins based on the intensity of total protein dye. See Fig. S1 and STAR Methods for details. (D) Histogram of total protein content per cell in each bin remeasured after sorting. (E) Normalized Transcripts Per Million (TPM / mean TPM) for WHI5 and MDN1 mRNA in cells of different sizes (total protein content). The mean (±range) of two biological replicates is plotted. Changes in TPM are proportional to changes in mRNA concentration. (F) Normalized TPM x total-mRNA for WHI5 and MDN1 mRNA in cells of different sizes (total protein content). Mean (±range) of two biological replicates is plotted. Changes in TPM x total mRNA are proportional to changes in mRNA amount. Relative total mRNA per cell was determined by the number of reads relative to those from a fixed number of S. pombe cells added to the sample.
(G-I) single-molecule Fluorescence In Situ Hybridization (smFISH) analysis of WHI5 and MDN1 mRNA. (G) Representative smFISH images. (H&I) mRNA counts per cell as a function of cell volume for WHI5 and MDN1 determined by smFISH, n=567 cells. Linear regression (solid line) and 95% confidence interval (dashed lines) are shown. Data are pooled from two biological replicates. The same data with replicates plotted independently are shown in Fig. S3A&B.

