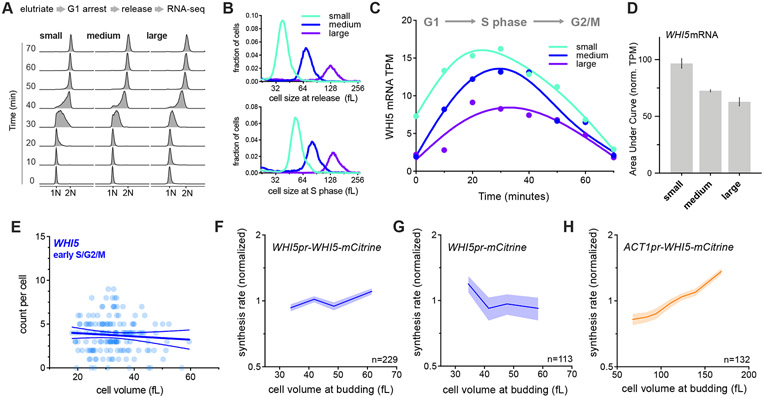
Figure 2 ∣. WHI5 sub-scaling occurs across the cell cycle and is encoded in the WHI5 promoter.
See also Figures S1&S3.
(A-D) G1 cells of different sizes (small, medium, and large) were arrested for increasing amounts of time in G1 using a temperature sensitive cdc28-13 allele at 37°C. Cells were then released from G1 to progress synchronously through a full cell cycle and analyzed by RNA-seq. See Fig. S2 for details. (A) DNA content analysis determined by flow cytometry. (B) Size distributions at point of release from G1 arrest (top panel) and at mid S-phase (bottom panel, corresponds to the 40-minute time point). (C) WHI5 mRNA TPM and (D) the Area Under the Curve (AUC) of mean normalized WHI5 mRNA TPM for small, medium large cells synchronously progressing through the cell cycle. The AUC mean (± range) of two biological replicates is plotted.
(E) mRNA counts per cell for WHI5 as a function of cell size in early S/G2/M cells determined by smFISH; n=156 cells. Early S/G2/M cells were defined as budded cells with a small (≤ 0.2) bud-to-mother volume ratio. Linear regression (solid line) and 95% confidence interval (dashed lines) are shown. Data are pooled from two biological replicates. The same data with replicates plotted independently, including data for MDN1, are shown in Fig. S3E&F.
(F-H) Protein synthesis rates normalized to the mean as a function of cell volume at budding were determined by time-lapse fluorescence microscopy measuring Whi5-mCitrine expressed from (F) the endogenous WHI5 promoter or (H) the ACT1 promoter, and (G) mCitrine expressed alone from the WHI5 promoter. Synthesis rates were determined as in Schmoller et al. (2015) for single cells using linear fits to protein amount traces for the period between bud emergence and cytokinesis (S/G2/M). Data are binned according to cell volume at budding and the mean (±SEM) of each bin is plotted. Un-binned single-cell values from the same data are plotted in Fig. S3G-I.

