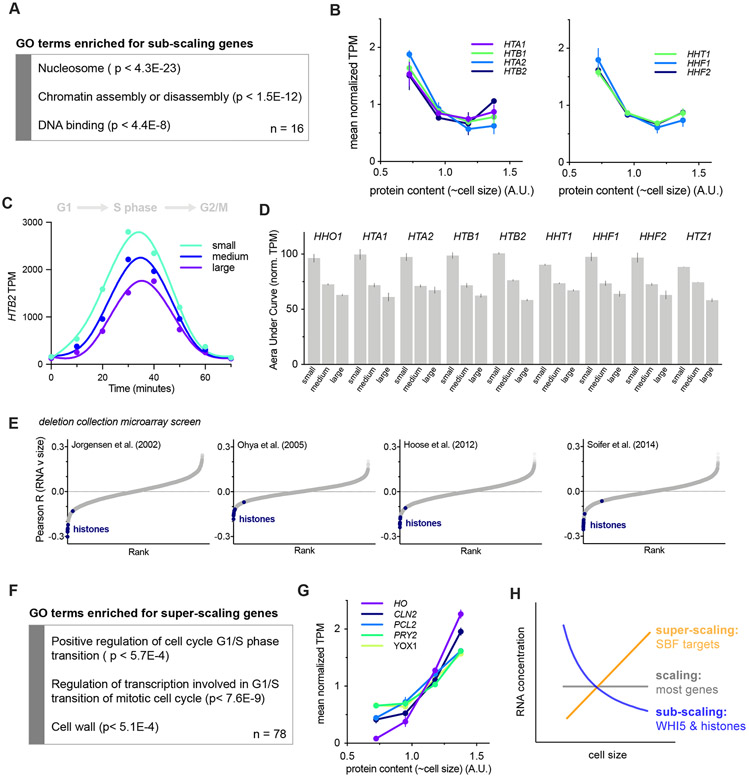
Figure 3 ∣. Histones are a rare class of sub-scaling genes.
See also Figures S1-2 & S4-6.
(A) Gene ontology terms enriched in sub-scaling genes. 9 of the 16 sub-scaling genes encode histones and one is WHI5. See Fig. S4A and STAR Methods for classification details.
(B) Normalized TPM (TPM / mean TPM) for sub-scaling histone mRNAs in cells of different sizes (total protein content). The mean (±range) of two biological replicates is plotted. Changes in TPM are proportional to changes in mRNA concentration. See Fig. S1 for experimental details.
(C) HTB2 mRNA TPM for small, medium, and large cells synchronously progressing through the cell cycle as in Fig. 2C-D. See Fig. S2 for experimental details.
(D) The Area Under the Curve (AUC) of mean normalized sub-scaling histone mRNA TPM of small, medium, and large cells synchronously progressing through the cell cycle. The AUC mean (±range) of two biological replicates is plotted.
(E) Pearson correlation coefficient R for the correlation between Histone mRNA levels, relative to wild-type, in 1,484 gene deletion strains (Kemmeren et al., 2014; O'Duibhir et al., 2014) and the cell size of the respective gene deletions for four different data sets of size measurements (Hoose et al., 2012; Jorgensen et al., 2002; Ohya et al., 2005; Soifer and Barkai, 2014). Each point represents an individual mRNA species. Histone mRNAs are shown in blue. The individual regression fits for the histone transcript levels with cell size determined by Jorgensen et al. are shown in Fig. S4D.
(F) Gene ontology terms enriched in super-scaling genes. See Fig. S6A and STAR Methods for classification details.
(G) Normalized TPM (TPM / mean TPM) for example super-scaling mRNAs, specifically those known as targets of the SBF transcription factor, in cells of different sizes (total protein content). The mean (±range) of two biological replicates is plotted. Changes in TPM are proportional to changes in mRNA concentration. See Fig. S1 for experimental details.
(H) Schematics illustrating the scaling, sub-scaling and super-scaling trends of gene expression, representative of most genes, WHI5 and histones, and a subset of SBF targets respectively.

