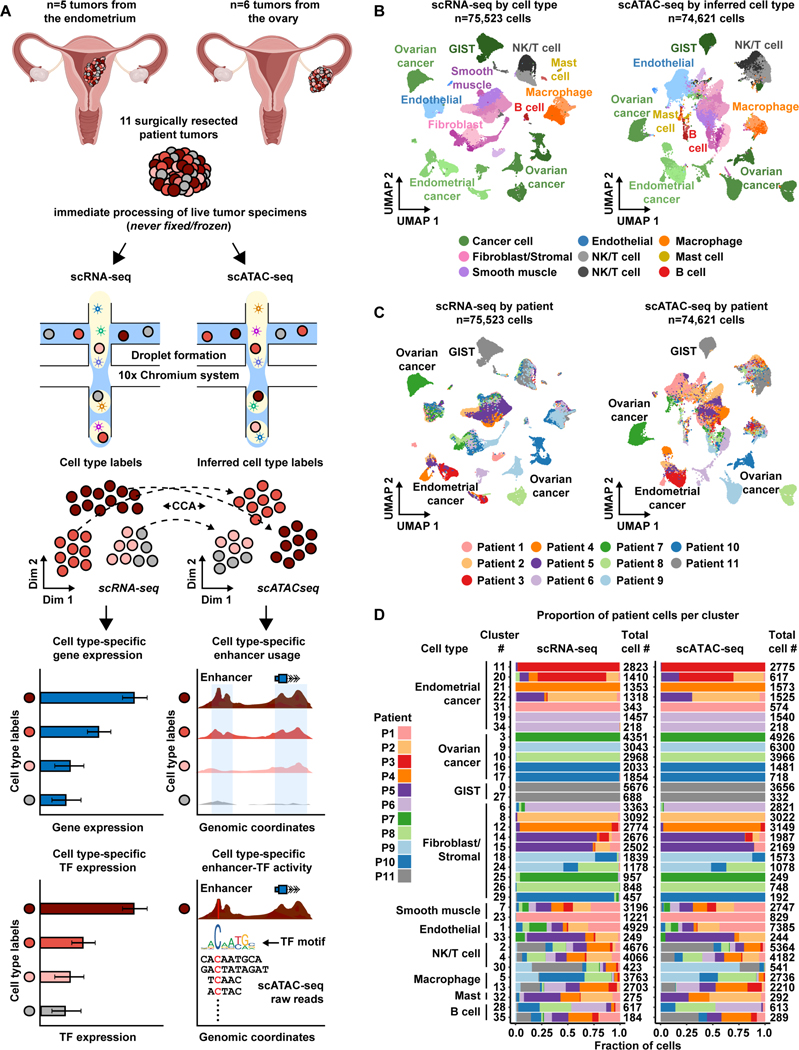
Figure 1. Overview of matched scRNA-seq and scATAC-seq workflow for patient tumors.
A) Cartoon showing patient tumor workflow. The female reproductive system cartoons, top, were created with BioRender.com.
B) UMAP plot all scRNA-seq cells color-coded by cell type across 11 patient tumors (left). UMAP plot of all scATAC-seq cells color-coded by inferred cell type across 11 patient tumors (right).Color shades denote subclusters within each cell type.
C) UMAP plot of scRNA-seq cells (left) and scATAC-seq cells (right) as shown in panel B but color-coded by patient of origin.
D) Stacked bar charts showing contribution of each patient to each subcluster in scRNA-seq (left) and to each inferred cell type subcluster in scATAC-seq (right).

