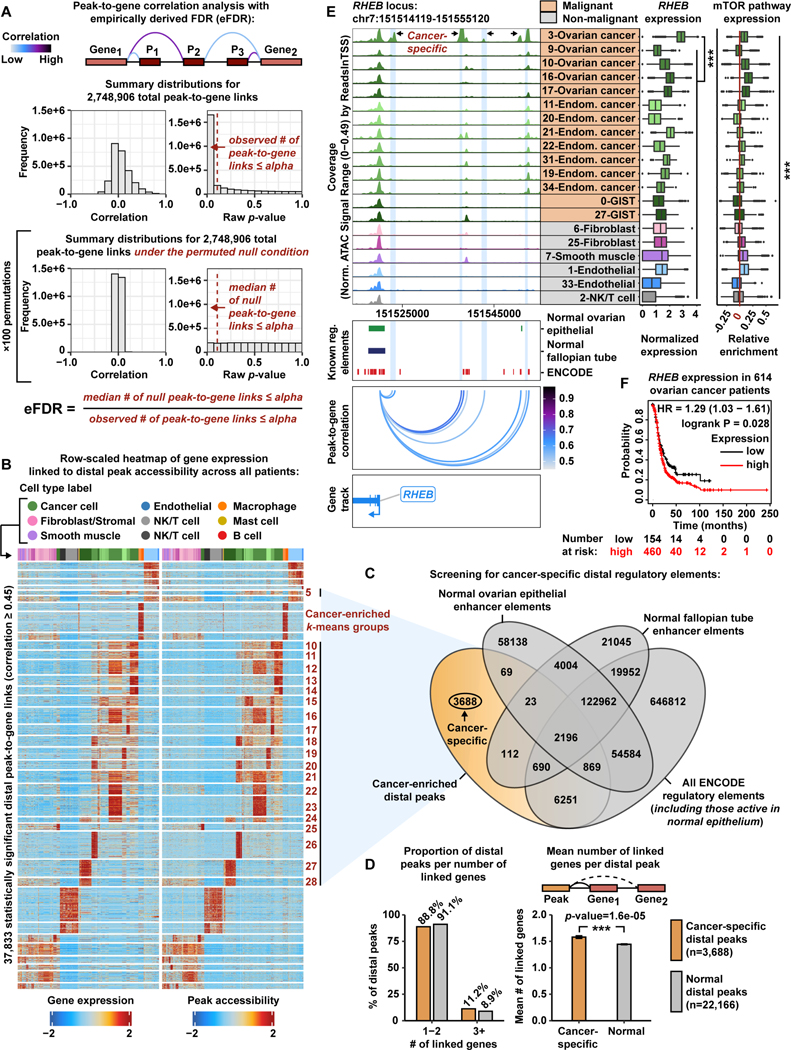
Figure 2. Systematic in silico identification of cancer-specific distal regulatory elements.
A) Cartoon showing peak-to-gene correlation analysis with an eFDR (top).Histograms of correlation values and raw p-values for n=2,748,906 peak-to-gene link tests (middle) and peak-to-gene link tests under the null condition (bottom). Dashed red lines represent the alpha threshold or raw p-value cutoff of 1e-12 for calling statistically significant peak-to-gene links.
B) Row-scaled heatmaps of statistically significant distal peak-to-gene links. Each row represents expression of a gene (left) correlated to accessibility of a distal peak (right). Cancer-enriched k-means clusters are marked in red. Distal peaks participating in cancer-enriched k-means groups are used in the overlap analysis presented in panel C.
C) Venn diagram showing the number of cancer-specific distal peaks (orange) after overlapping the genomic coordinates of cancer-enriched distal peaks with the genomic coordinates of normal ovarian surface epithelium enhancer elements, normal fallopian tube enhancer elements, and all ENCODE regulatory element annotations (gray).
D) Bar charts comparing proportion of distal peaks per number of linked genes between cancer-specific (orange) and normal (gray) distal peak groups (left).Bar chart comparing mean number of linked genes per distal peak between cancer-specific (orange) and normal (gray) distal peak groups (right). Asterisks denote a statistically significant difference (Wilcoxon Rank Sum test). Error bars represent ±1 S.E.M.
E) Browser track showing the accessibility profile at the RHEB locus across all malignant subclusters (orange) and select non-malignant subclusters (gray) (left). Putative cancer-specific dREs for RHEB are highlighted by light blue shadows. Matching scRNA-seq expression of RHEB is shown for each subcluster (middle). Asterisks denote a statistically significant difference in gene expression between cells in the 3-Ovarian cancer subcluster and all remaining subclusters (average logFC > 1.0 & Bonferroni-corrected p-value <0.01, Wilcoxon Rank Sum test). Relative expression of mTOR pathway members is shown in the box plot (right). Asterisks denote statistically significant differences in mTOR pathway expression across all subclusters (Kruskal-Wallis test, p-value <0.01). Known regulatory element annotations, as used in panel C, are shown below the browser track. Peak-to-gene loops show the correlation value between peak accessibility and RHEB expression (bottom).
F) Kaplan-Meier survival curve based on progression-free survival for 614 OC patients stratified by high and low RHEBexpression.

