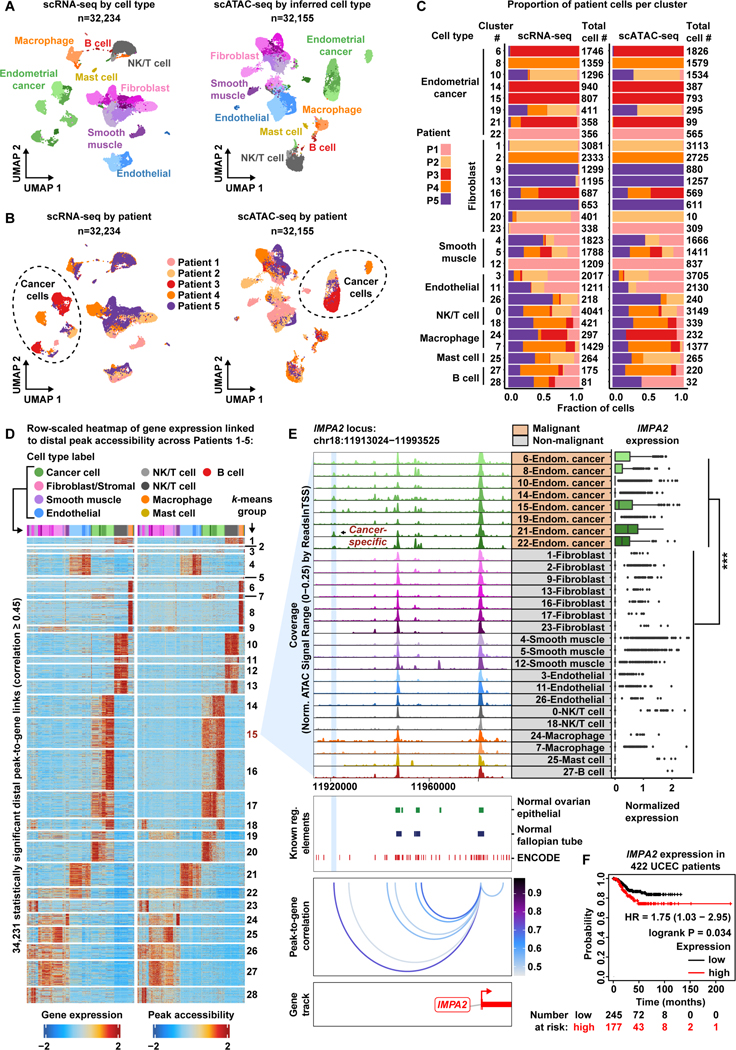
Figure 3. A cancer-specific distal regulatory element helps drive IMPA2 expression within the Endometroid Endometrial Cancer patient cohort.
A) UMAP plot of scRNA-seq cells color-coded by cell types found in Patients 1–5 (left). UMAP plot of scATAC-seq cells color-coded by inferred cell type across Patients 1–5 (right).
B) UMAP plot of scRNA-seq cells as shown in panel A but color-coded by patient of origin (left). UMAP plot of scATAC-seq cells as shown in panel A but color-coded by patient of origin (right).
C) Stacked bar charts showing contribution of each patient to each subcluster.
D) Row-scaled heatmaps of statistically significant distal peak-to-gene links where each row represents expression of a gene (left) correlated to accessibility of a distal peak (right). Select k-means clusters containing IMPA2 are marked in red text.
E) Browser track showing the accessibility profile at the IMPA2 locus across all cell type subclusters (left). Subclusters are color-coded either malignant (orange) or non-malignant (gray). Putative cancer-specific dRE of IMPA2 is highlighted by the light blue shadow. Matching scRNA-seq expression of IMPA2 is shown for all subclusters (right). Asterisks denote a statistically significant difference in gene expression between cells in marked subclusters when aggregated (average logFC = 0.23 & Bonferroni-corrected p-value <0.01, Wilcoxon Rank Sum test). Known regulatory element annotations for normal ovarian surface epithelium, normal fallopian tube, and ENCODE, are shown below the browser track. Peak-to-gene loops show the correlation value between peak accessibility and IMPA2 expression (bottom).
F) Kaplan–Meier survival curve based on recurrence-free survival for 422 Uterine Corpus Endometrial Carcinoma (UCEC) patients stratified by high and low IMPA2 expression.

