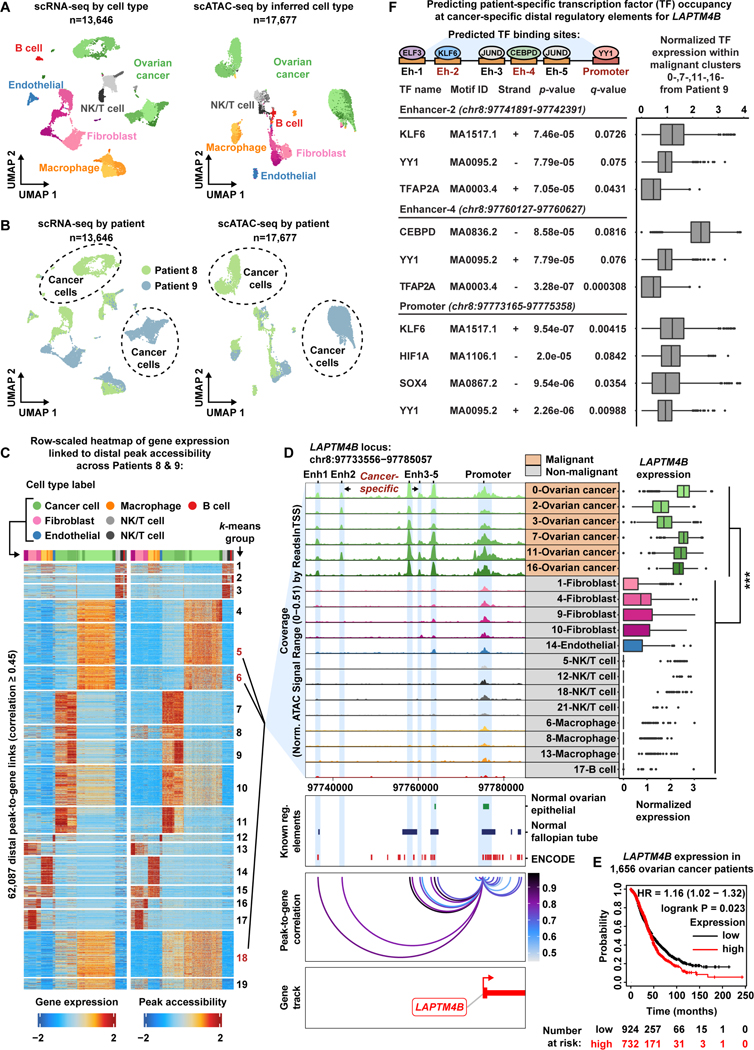
Figure 4. Malignant populations of the High-Grade Serous Ovarian Cancer patient cohort acquire novel enhancer-like elements that drive LAPTM4B expression.
A) UMAP plot of scRNA-seq cells color-coded by cell types found in Patients 8 and 9 (left). UMAP plot of scATAC-seq cells color-coded by inferred cell type across Patients 8 and 9 (right).
B) UMAP plot of scRNA-seq cells as seen in panel A but color-coded by patient of origin (left). UMAP plot of scATAC-seq cells as seen in panel A but color-coded by patient of origin (right).
C) Row-scaled heatmaps of statistically significant distal peak-to-gene links where each row represents expression of a gene (left) correlated to accessibility of a distal peak (right). Select k-means clusters containing LAPTM4B are marked in red text.
D) Browser track showing the accessibility profile at the LAPTM4B locus across all subclusters (left). Subclusters are color-coded either malignant (orange) or non-malignant (gray). Putative dREs of LAPTM4B are highlighted by light blue shadows. Matching scRNA-seq expression of LAPTM4B is shown in the box plot (right) for all subclusters. Asterisks denote a statistically significant difference in gene expression between cells in marked subclusters when aggregated (average logFC = 1.77 & Bonferroni-corrected p-value <0.01, Wilcoxon Rank Sum test). Known regulatory element annotations for normal ovarian surface epithelium, normal fallopian tube, and ENCODE, are shown below the browser track. Peak-to-gene loops show the correlation value between peak accessibility and LAPTM4B expression (bottom).
E) Kaplan-Meier survival curve based on overall survival for 1,656 OC patients stratified by high and low LAPTM4B expression.
F) Summary cartoon and table of Find Individual Motif Occurrences (FIMO) predictions within Enhancer 2, Enhancer 4 and LAPTM4B promoter (top, middle, bottom, respectively). Matching scRNA-seq TF expression in the malignant fraction of Patient 9 is shown in the box plots (right).

