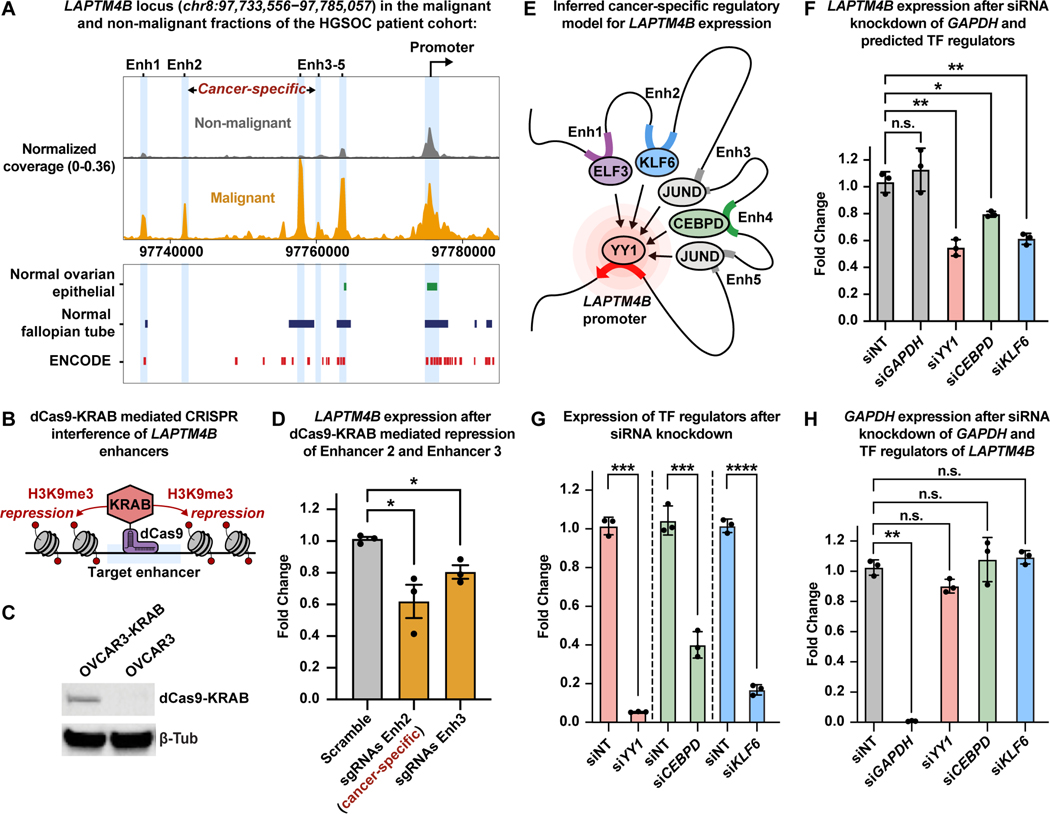
Figure 5. Functional validation of cancer-specific LAPTM4B regulatory model in high-grade serous ovarian cancer cells.
A) Browser track showing the accessibility profile at the LAPTM4B locus, as in Fig. 4D, but between malignant (orange) and non-malignant (gray) fractions of the HGSOC patient cohort. Coverage is normalized by sequencing depth as well as reads in TSS regions. Known regulatory element annotations for normal ovarian surface epithelium, normal fallopian tube, and ENCODE, are shown below the browser track.
B) Cartoon of dCas9-KRAB mediated CRISPR interference.
C) Western blot of OVCAR3 cells stably expressing dCas9-KRAB.
D) RT-qPCR results showing expression of LAPTM4B after dCas9-KRAB mediated repression of Enhancer 2 and Enhancer 3. Expression is shown as fold change relative to ACTB expression.
E) Cartoon depicting inferred TF-mediated enhancer-promoter connections.
F) RT-qPCR results of LAPTM4B expression after siRNA-mediated knockdown of GAPDH and predicted TF regulators: YY1, CEBPD, and KLF6. Expression is shown as fold change relative to ACTB expression.
G) RT-qPCR results of expression of TF regulators after siRNA knockdown. Expression is shown as fold change relative to ACTB expression.
H) RT-qPCR results of expression of GAPDH after siRNA-mediated knockdown of GAPDH and TF regulators. Expression is shown as fold change relative to ACTB expression. Data in D, F, G, and H shown as mean ± S.E.M.; *p< 0.05, **p< 0.01, ***p< 0.001, one-tailed Welch’s t-test.

