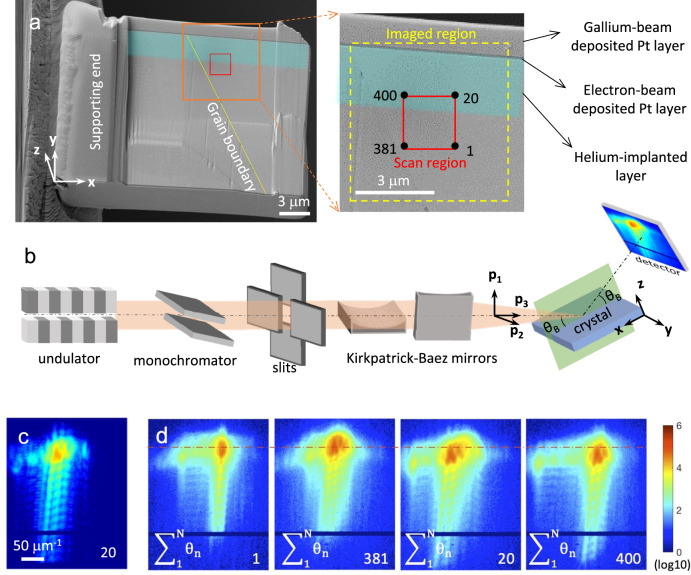
Fig. 1. X-ray diffraction microscopy of the He-implanted tungsten foil.
a Scanning electron microscopy images of the tungsten foil sample. The platinum protection layers, helium-implanted layer and the grain boundary are indicated. The red rectangle shows the extreme probe positions used during the ptychography raster scan (noted as ‘1’, ‘20’, ‘381’ and ‘400’, in agreement with their order within the full scan), while the dashed yellow rectangle corresponds to the area finally imaged with BP. b Experimental setup for Bragg ptychography at the synchrotron beamline, detailing the main components used to condition the beam and detect the diffraction signal. The sample frame (x, y, z) and the probe frame (p1, p2, p3) are defined. c Example of a diffraction pattern, obtained at the maximum of the Bragg peak, at position 20. d A series of four diffraction intensity patterns integrated overall angles along the rocking curve, plotted for the four extreme positions of the raster scan. For (c, d) the used logarithmic colour scale is indicated.

