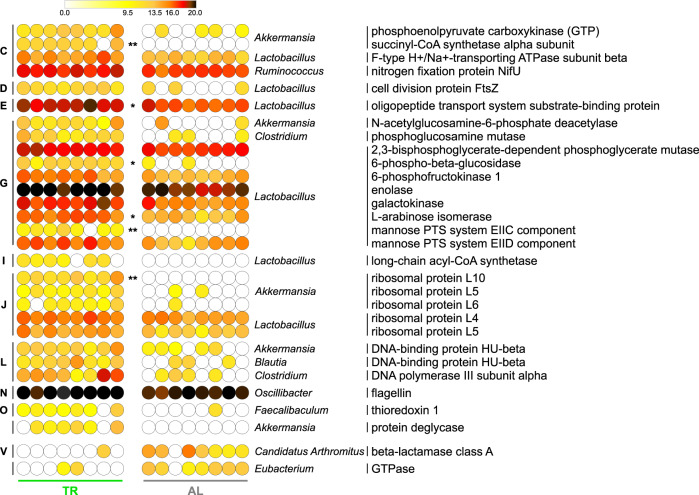
Fig. 4. Changes in the functional profile of the fecal metaproteome of TR- vs. AL-fed rats.
Heatmap illustrating genus-specific functions with significantly differential abundance between AL and TR groups (FDR < 0.1). A single or double asterisk refers to FDR < 0.01 or <0.001, respectively. Each dot indicates a different sample; the color gradient is based on the relative abundance of functions. Functions are ordered sequentially: (i) according to the group of rats in which they are significantly more abundant, indicated in the bottom; (ii) according to their COG category, indicated close to the left margin of the heatmap (C, Energy production and conversion; D, Cell cycle control, cell division, chromosome partitioning; E, Amino acid transport and metabolism; G, Carbohydrate transport and metabolism; I, Lipid transport and metabolism; J, Translation, ribosomal structure and biogenesis; L, Replication, recombination and repair; N, Cell motility; O, Posttranslational modification, protein turnover, chaperones; V, Defense mechanisms); (iii) according to the taxonomic genus to which they were assigned, indicated close to the right margin of the heatmap; (iv) in alphabetical order.

