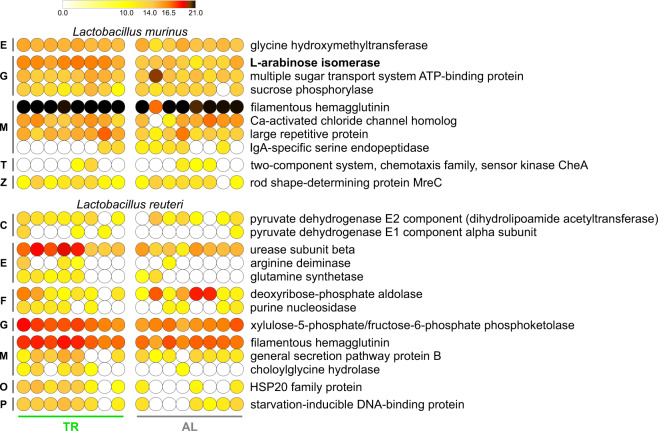
Fig. 5. Lactobacillus murinus/reuteri-specific functions detected in fecal metaproteome samples of TR- and AL-fed rats.
Functions in bold are differentially abundant between the two groups (FDR < 0.1; see Supplementary Fig. 9). Each dot indicates a different sample. The color gradient is based on the relative abundance of functions. Functions are ordered sequentially: (i) according to their COG category, indicated close to the left margin of the heatmap (C, Energy production and conversion; E, Amino acid transport and metabolism; F, Nucleotide transport and metabolism; G, Carbohydrate transport and metabolism; M, Cell wall/membrane/envelope biogenesis; O, Posttranslational modification, protein turnover, chaperones; P, Inorganic ion transport and metabolism; T, Signal transduction mechanisms; Z, Cytoskeleton); (ii) according to their average relative abundance.

