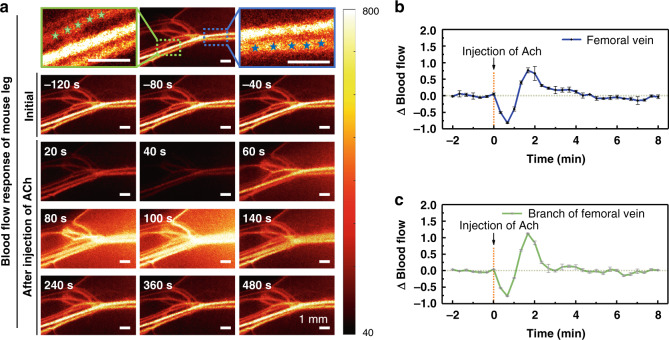
Fig. 5. Maps of dynamic response of blood flow in the hindlimb of mice.
a Typical blood flow maps of subcutaneous blood vessels before and after the injection of Ach. The blue and green asterisks state the femoral vein and its branch. b, c Statistical analysis based on blood vessel positions indicated by asterisks in the blue and green solid line rectangular boxes was performed to show the relative changes in blood flow of femoral vein (b) and its branch (c) over time. Data are expressed in (mean ± standard error)

