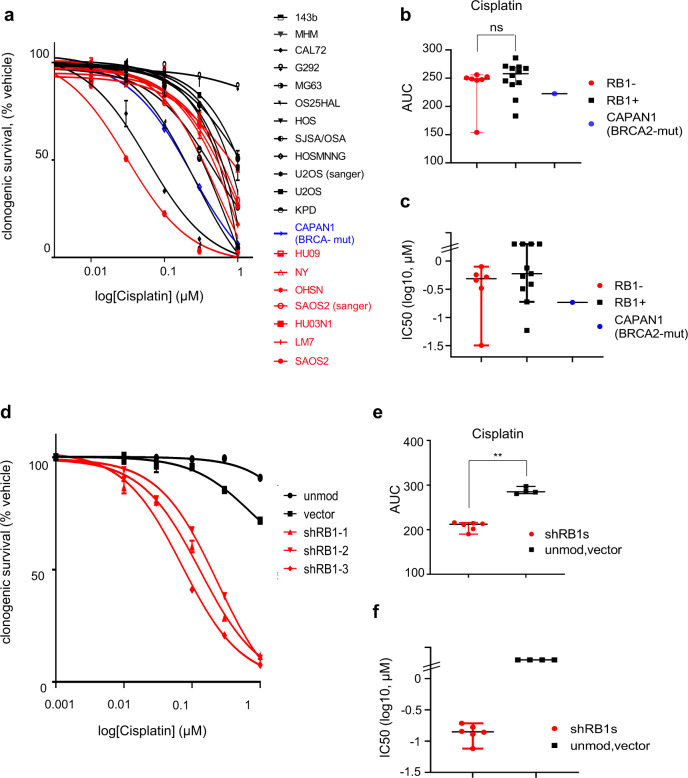
Fig. 6. Platinum sensitivity in RB1-defective osteosarcoma.
Cells seeded at low density into six-well plates were cultured in the presence of increasing concentrations of cisplatin or vehicle (DMSO). Colonies arising were stained using crystal violet dye. Clonogenic survival was quantified using dye extraction. a–c Platinum response in RB1-defective (red) or RB1-normal (black) osteosarcoma and BRCA2-mutant CAPAN1 (blue). a Concentration-response curve and b scatter plots depicting AUC value comparison and c log IC50 values, deduced from the concentration-response data in a. Bars in scatter plots (b, c) depict median (±95%CI), calculated using a two-tailed Mann–Whitney test, p (b) = 0.3730ns. Data points in a–c reflect the mean of parallel duplicate wells for n = 1 dataset. d–f RB1-normal osteosarcoma CAL72 cells transduced with lentivirus vector encoding different RB1-targeting shRNAs (shRB1-1, shRB1-2 or shRB1-3) (red), or empty vector backbone (vector), or left unmodified (unmod) (black). d Concentration-response curve, e scatter plots depicting AUC value comparison and f log IC50 values, deduced from the concentration-response data in d. Bars in scatter plots (e, f) depict median ±95%CI. Data in d depict means of parallel duplicate wells for one of n = 2 biologically independent datasets, data in e and f summarise results for n = 2 biologically independent datasets. p (e) = 0.0095, calculated using a two-tailed Mann–Whitney test, **p < 0.01. Source data are provided as a Source Data file.

