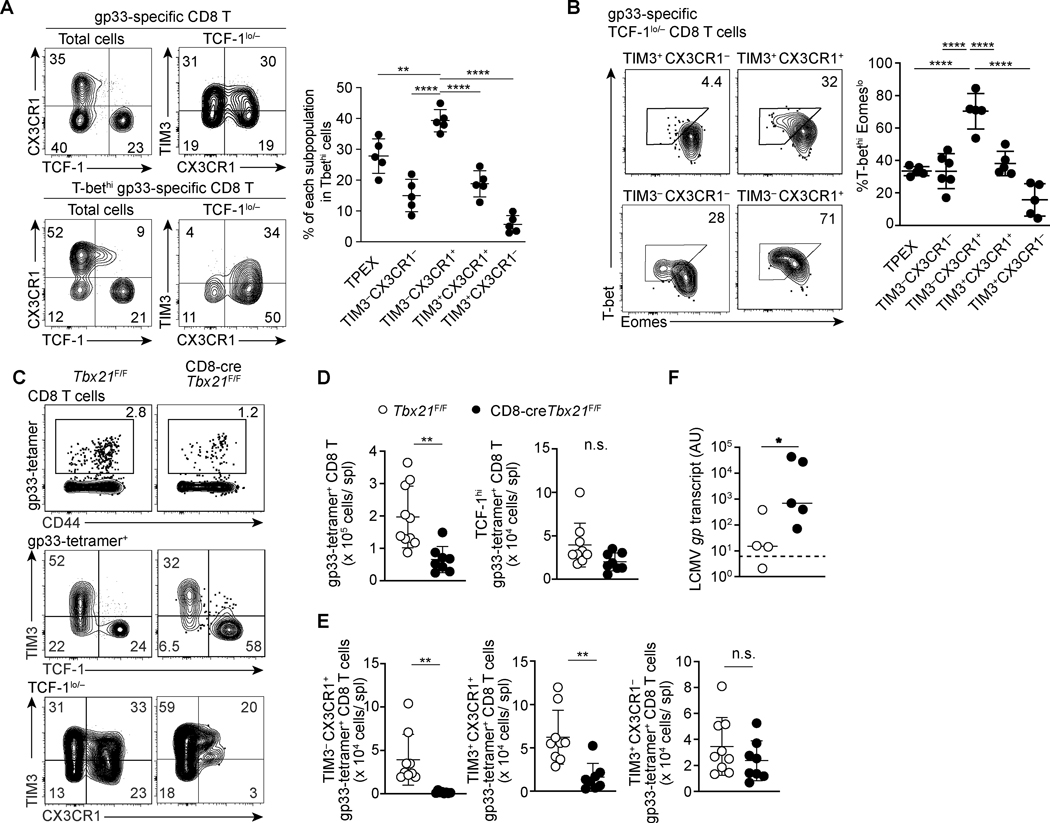
FIGURE 3. T-bet is critical for maintenance of CX3CR1+ exhausted CD8 T cell populations.
(A) Flow cytometry plots showing expression of indicated molecules within total and T-bethi gp33-specific CD8 T cells 22dpi LCMV-c13 infection. Data are representative of 3 independent experiments with n=4–6 mice each. (B) Flow cytometry plots showing expression of T-bet and Eomes in the indicated subsets of gp33-specific CD8 T cells in the spleen on 22 dpi with LCMV-c13 infection. Data are representative of 3 independent experiments with n=5 mice each. (C-E) Flow Cytometry showing expression of TCF-1, CX3CR1, and TIM3 by gp33-specific CD8 T cells in control Tbx21F/F and CD8-cre Tbx21 F/F mice on 29 dpi with LCMV-c13. Representative flow cytometry plots are shown in (C) with frequencies of gated cells in each parental population, and statistical analyses are shown in (D) and (D). Data are shown as mean ±SD and are pooled from 3 independent experiments with n>8 mice per genotype. Dots in the graphs in (A), (C) and (D) indicate individual mice. Data in (A), (C) and (D) are shown as mean ± SD. Statistical differences in (A) were tested using one-way ANOVA with a Tukey post-hoc test. For (C) student’s t-test was used. And for (D) Mann-Whitney test was used. (F) LCMV-gp mRNA abundance in plasma as assessed by qRT-PCR in Tbx21F/F and CD8-cre Tbx21F/F mice on 100 dpi with LCMV-c13. Data are pooled from two independent experiments with n=4 (Tbx21F/F) and n=5 (CD8-cre+ Tbx21F/F) mice per genotype in total. Horizontal bars indicate median for samples in each genotype and the statistical differences were assessed by Mann-Whitney U-test. The dotted line indicates the limit of detection.

