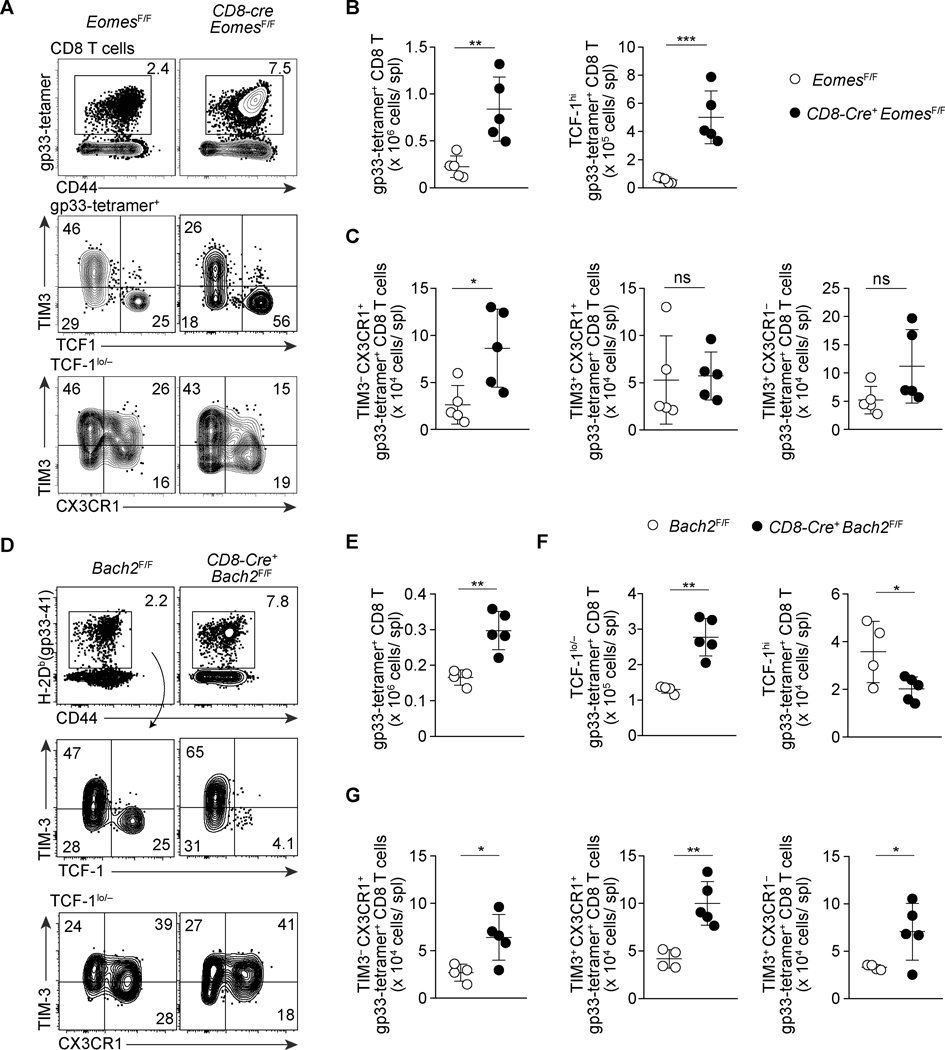
FIGURE 4. Opposing roles of EOMES and BACH2 in the differentiation of progenitor-like subsets of exhausted CD8 T cells.
(A-C) Flow Cytometry showing expression of CD44, TCF-1, CX3CR1, and TIM3 of gp33-tetramer+ CD8 T cells in the spleen of control EomesF/F and CD8-cre EomesF/F mice on 28 dpi with LCMV-c13. Representative flow cytometry plots are shown in (A) with frequencies of gated cells in each parental population, and statistical analyses are shown in (B) and (C). Data are representative of 3 independent experiments with n=4–6 mice per genotype in each experiment. (D-G) Flow Cytometry showing expression of TCF-1, CX3CR1, and TIM3 of gp33-tetramer+ CD8 T cells in Bach2F/F and CD8-Cre+Bach2F/F mice 30 days after LCMV-c13 infection. Representative flow cytometry plots are shown in (D) with frequencies of gated cells in each parental population, and statistical analyses are shown in (E)-(G). Data are pooled from two independent experiments with n=4 (Bach2F/F) and n=5 (CD8-Cre+Bach2F/F) in total. All statistical analysis plots are shown as mean ± SD with statistics performed using an unpaired t-test.

