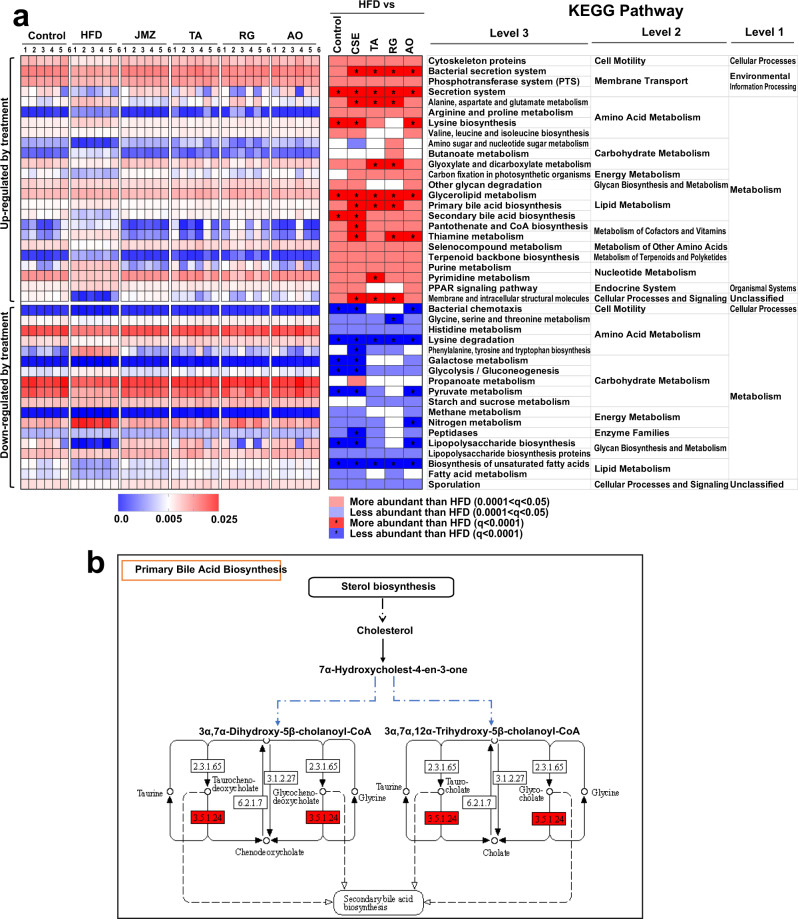
Fig. 6. KEGG pathway analysis.
Metabolic pathway with significant enhancement by CSE treatment (a). The heatmaps on the left show that the relative abundance of several metabolic pathways was altered. Statistical analysis of the differences between the groups was performed using the original false discovery rate method of Benjamini and Hochberg. In the image, red represents increased relative abundance, blue represents decreased relative abundance, and * represents Q < 0.0001. The corresponding genus information is on the right. Effects of CSE on the primary bile acid biosynthesis pathway (b).

