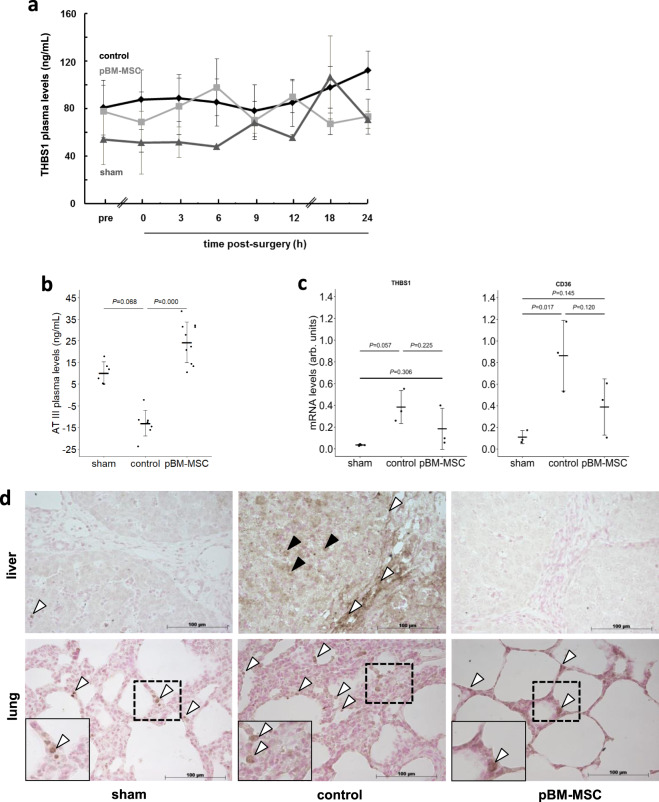
Fig. 3. Plasma levels and expression of THBS1 after ePHx with and without MSC treatment.
Plasma samples from five animals in each of the control and MSC-treated group, and three in the sham group were collected at the indicated time points, and a THBS1 and b Antithrombin III levels determined by ELISA (means ± SD). The Kruskal–Wallis test was performed (P = 0.0001) and significant differences between the groups were evaluated by post hoc Bonferroni test. c THBS1 and CD36 mRNA levels were determined in liver samples of three animals in each group at 24 h after hepatectomy. PCR products were quantified using PPIA (Peptidylprolyl Isomerase A) for normalization. Values are given as means ± SD (n = 3; statistics: one-way ANOVA) as calculated from the representative gels shown in Supplementary Fig. 2. d Immunohistochemical detection of THBS1 (arrowheads) in the liver (upper images) and lung (lower images) of sham (left), control (middle), and MSC-treated (right) pigs at 24 h after liver surgery. Images show ×20 original magnifications of representative organ tissue slices from three pigs per group. In the liver, staining is located in the portal tracts lining blood vessels and bile ducts (white arrowheads) and in the parenchyma (black arrowheads). In the lung, THBS1 is expressed in cells lining the alveolae (white arrowheads; the insets show higher magnifications (computed) of the dashed areas).

