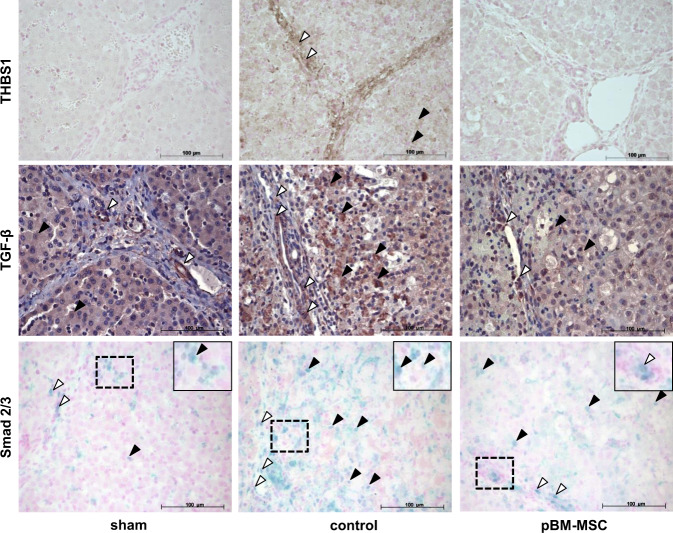
Fig. 8. MSC treatment attenuates the ePHx-dependent increase in THBS1, TGF-β, and activated Smad 2/3 staining.
Immunohistochemical detection of THBS1 (brown, upper panels), TGF-β (brown, middle panels), and Smad 2/3 (blue, bottom panels) in livers of sham- (left column), control- (middle column), and MSC-treated (right column) pigs. Tissue samples were taken at 24 h after resection. Images are representative for three slices out of the organs of three animals per group. White and black arrowheads indicate portal tract and parenchymal localization, respectively. Original magnification, ×20. The insets show higher magnifications (computed) of the dashed areas.

