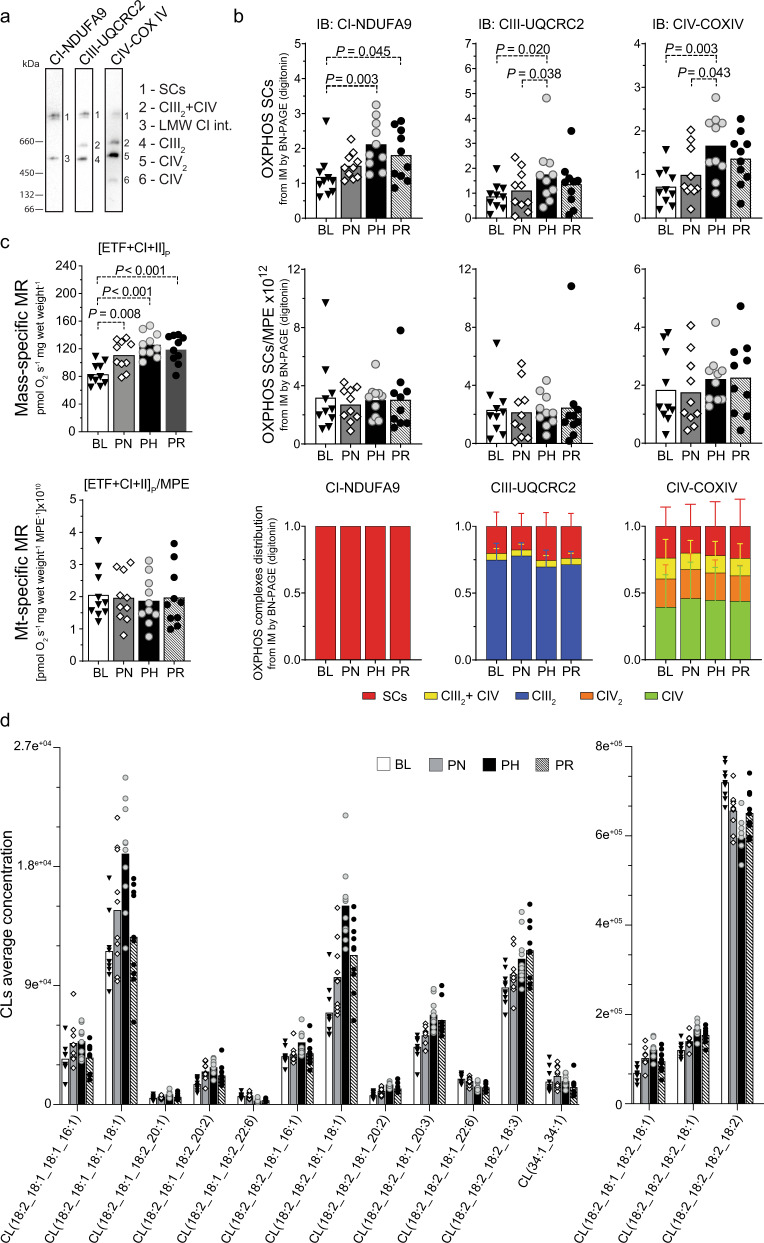
Fig. 5. Changes in mitochondrial content without reorganisation of SCs occur alongside improvements in mitochondrial respiration.
a Representative BN-PAGE blots of isolated mitochondria (IM) fractions from human vastus lateralis muscles (images from baseline [BL] IM fractions). Band 1 (SCs): mature supercomplexes (SCs) consisting of complex I + IIIn + IVn; band 2 (CIII2 + IV): a SC consisting of CIII and CIV; band 3 (LMW CI int): low molecular weight intermediate of CI (band not present in all samples); band 4 (CIII2): CIII dimer; band 5 (CIV2): CIV dimer; band 6 (CIV): CIV monomer. b Top panels: protein content of SCs of the electron transport chain (ETC) by BN-PAGE in IM fractions from human vastus lateralis muscle biopsies (antibodies probed on separate membranes); middle panels: values from top panels normalised by mitochondrial protein enrichment (MPE); lower panels: distribution of ETC complexes into SCs from images obtained in b at each time point. Source data are provided as a Source Data file. All samples analysed were derived from the same experiment and blots were processed in parallel. c Top panel: maximal mass-specific mitochondrial respiration (MR) in permeabilised human vastus lateralis muscle fibres with convergent electron input through ETF + CI + CII ([ETF + CI + II]P); lower panel: values of mitochondrial- (mt-) specific MR, obtained after normalising values from the top panel by MPE ([ETF + CI + II]P/MPE). Results for the entire substrate-uncoupler-inhibitor-titration (SUIT) protocol are shown in Supplementary Fig. 1b. P values are indicated on the figure to three decimal places; for P values that were truncated, the corresponding accurate P values were: PH vs. BL: P = 5.2e−5; PR vs. BL: P = 4.5e−4. Source data are provided as a Source Data file. d Training-induced changes in all individual cardiolipin (CL) species that were identified as differentially expressed (as determined in Fig. 4c, by linear model fit using limma with empirical Bayes method with an adjusted P < 0.05 [Benjamini–Hochberg]). Source data are provided as a Source Data file. PN post-NVT, PH post-HVT, PR post-RVT, IB immunoblotting. For panels b–d filled triangles, empty diamonds, and empty and filled circles represent individual values; the maxima of each bar represents the mean value; n = 10 for all analyses; datasets b and c were analysed by repeated measures one-way ANOVA followed by Tukey’s post hoc testing, except for the lower right panel of b, which was analysed by Friedman test followed by Dunn’s post hoc testing, as not normally distributed; P < 0.05.

