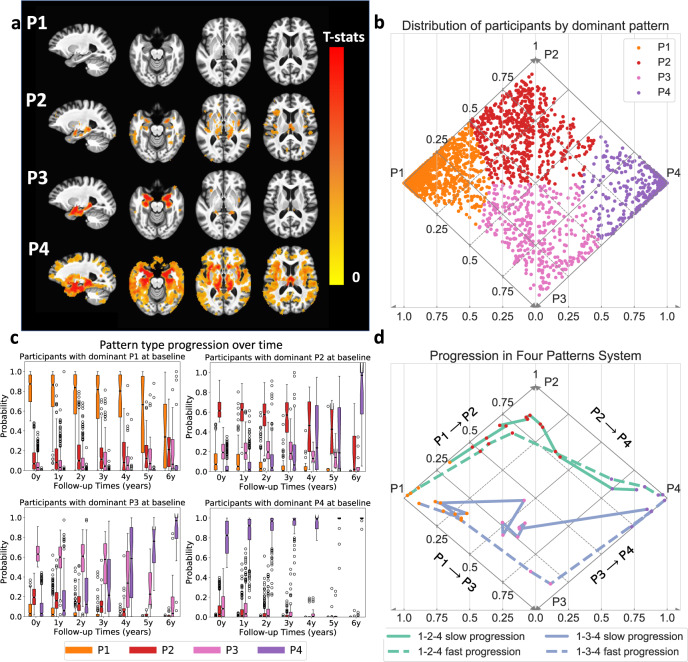
Fig. 2. Characterization of four atrophy patterns (P1–P4) and two progression pathways of neurodegeneration.
(Data from 899 ADNI2/GO participants in discovery set (a) and all 2832 ADNI/BLSA participants (b–d)). a Voxel-wise statistical comparison (one-sided t-test) between CN and participants predominantly belonging to each of the four patterns. False discovery rate (FDR) correction for multiple comparisons with p-value threshold of 0.05 was applied. b Visualization of participants’ expression of four patterns in a diamond plot. Pseudo-probabilities of belonging to each pattern reflect levels of expression (i.e., presence) of respective patterns and probabilistic subtype memberships. Horizontal axis indicates p1 and p4 probabilities and diagonal axes reveal p2 (solid lines) and p3 (dashed lines) probabilities. Since participants never have both P1 and P4 > 0, all observed pattern combinations can be represented in this diamond plot. Dots for individual participants are color coded by the dominant pattern. c Box and whisker plots of expression of the four patterns over time for each baseline pattern group. (center line, median; box limits, upper and lower quartiles; whiskers, 1.5× interquartile range; points, outliers). d Progression paths of four representative participants. Dashed lines show participants reaching P4 from P1 within 5 years and solid lines show those who take more than 10 years to reach P4 from P1. Source data are provided as a Source Data file.

