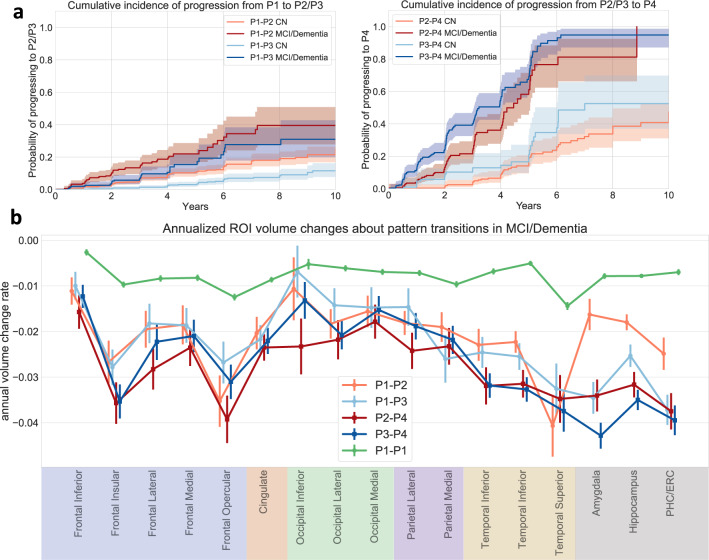
Fig. 4. Analysis of longitudinal pattern progression.
(Data from all 2832 ADNI/BLSA participants) a Cumulative incidence of pattern progression. The line styles indicate the diagnosis at baseline. 95% confidence intervals are shown with estimated cumulative incidence curves as centres. b Annual atrophy rate in selected GM regions along different paths. Data within 3 years before pattern change or last follow-up point (for stable P1 participants (P1-P1)) were utilized and random intercept mixed effect model with time as fixed effect was used to derive annual volume change rate with respect to baseline volume. Data are presented as estimated coefficient of time variable ±standard error. (PHC Parahippocampal gyrus, ERC Entorhinal cortex) Source data are provided as a Source Data file.

