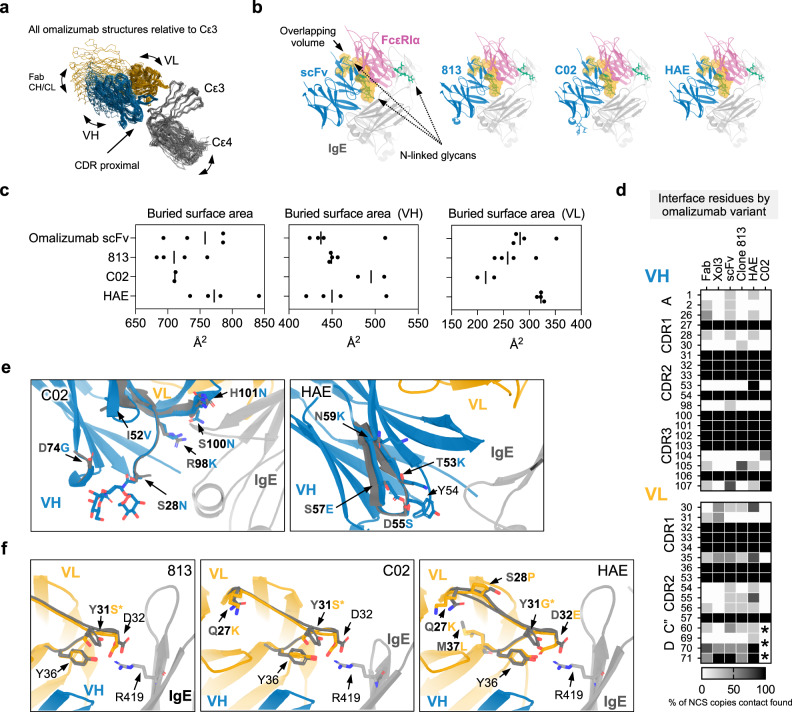
Fig. 4. Structural analysis of high-affinity disruptive omalizumab variants.
a Ribbon diagram of all omalizumab variants and omalizumab:IgE complexes aligned relative to Cε3 showing conservation of CDR proximal regions and variation in Fab CH/CL, IgE Cε4, VH and VL domains. b scFv structures were aligned relative to Cε3 domain at site 2 of the asymmetric FcεRIα:IgE-Fc complex. Maps of FcεRIα and each scFv were generated from each model and the volume of steric overlap between each map is depicted in orange, with FcεRIα associated glycans shown in green. c Plots of the buried surface area of all NCS related copies of each scFv, VH, and VL with IgE with mean surface area indicated. d Heat map of omalizumab contacts at interfaces across all structures. Shading reflects percentage of NCS related IgE:omalizumab interfaces at which a contact was identified. Asterisks denote region in which lack of density precluded modeling/interface-identification. e Detailed views of VH mutations (blue) aligned by variant to the native omalizumab scFv (dark gray), with IgE (light gray). f Same as in c for VL mutations, with IgE-R419 highlighted for reference. Source data are provided as a Source Data file.

