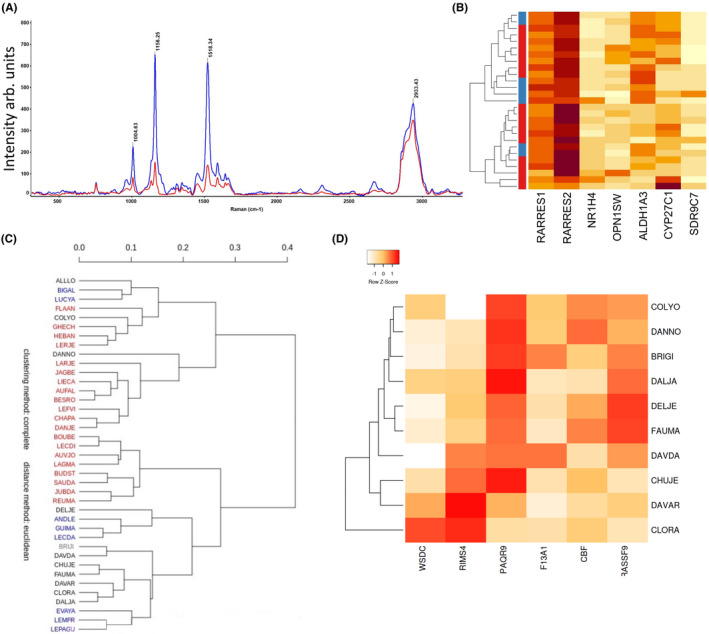
FIGURE 3.

Integration of molecular and Raman signatures highlighting Vitamin A pathway. (A) Average Raman spectra from which average background was subtracted for GBM group1 is indicated in Red and for GBM group2, indicated in Blue. (B) Heat map expression of seven genes, involved in the biosynthesis of vitamin A. (C) Hierarchical clustering of patients GBM mark group1 (red) and group2 (blue) and validation cohort (black). (D) Heatmap expression of six genes, robustly reflecting the classification using RS, and also the validation cohort
