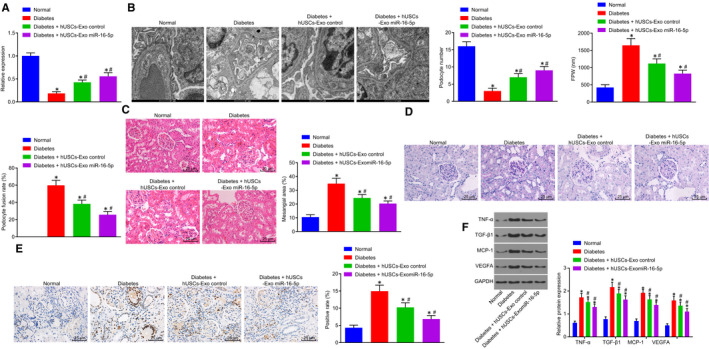
Figure 7.

hUSC‐miR‐16‐5p overexpression has a protective effect on podocytes in diabetic rats. A, miR‐16‐5p expression was measured by RT‐qPCR. B, TEM was used to observe the ultrastructure of podocytes, to count podocytes and to calculate the average of FPW and podocyte fusion rate (scale bar = 1 μm). C, the pathological changes of kidney tissue detected by HE staining (scale bar = 25 μm). D, PAS staining was used to observe the pathological changes of kidney tissue (scale bar = 25 μm). E, TUNEL was used to detect the apoptosis rate of kidney tissue (scale bar = 25 μm). F, the expression of VEGFA, MCP‐1, TGF‐β1 and TNF‐α was determined by Western blot analysis. *P < .05 vs the normal group; #P < .05 vs the diabetes group. Measurement data were expressed as mean ± standard deviation. Data among multiple groups were analysed using one‐way analysis of variance, and the experiment was repeated three times. FPW, foot process width; HE, haematoxylin‐eosin; hUSCs, human urine‐derived stem cells; MCP‐1, monocyte chemoattractant protein‐1; miR‐16‐5p, microRNA‐16‐5p; PAS, periodic acid‐Schiff; RT‐qPCR, reverse transcription‐quantitative polymerase chain reaction; TEM, transmission electron microscopy; TGF‐β1, transforming growth factor‐β1; TNF‐α, tumour necrosis factor‐α; TUNEL, Terminal deoxynucleotidyl transferase (TdT)‐mediated 2′‐Deoxyuridine 5′‐Triphosphate (dUTP) nick‐end labelling; VEGFA, vascular endothelial growth factor A
