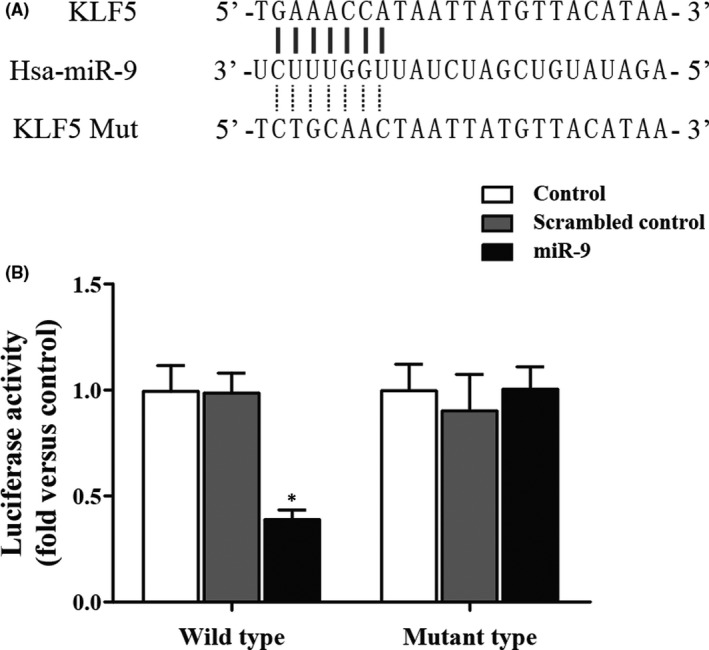
FIGURE 4.

The correlations between KLF5 and miR‐9 (mut: mutant). (A) Schematic comparison between miR‐9 and the “seed sequence” in the 3’UTR of KLF5. (B) Luciferase activities in the miR‐9 overexpressing cells transfected with wild‐type or mutant 3’UTR of KLF5 (Asterisk p value < 0.05 vs. control group, cells treated with control miRNAs were referred as the control group)
