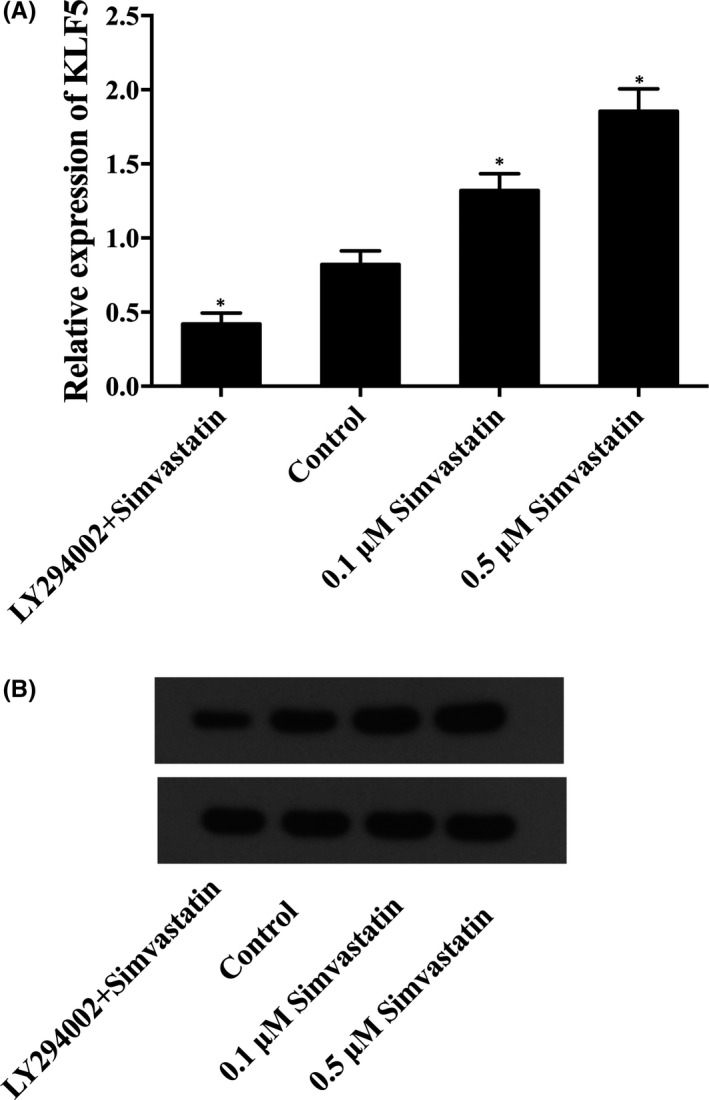
FIGURE 5.

The effect of simvastatin on the expression levels of KLF5 (asterisk p value < 0.05 vs. control group, untreated cells were referred as the control group). (A) KLF5 mRNA level of cells treated with different doses of simvastatin or LY294002. (B) KLF5 protein level of cells treated with different doses of simvastatin or LY294002
