FIGURE 1.

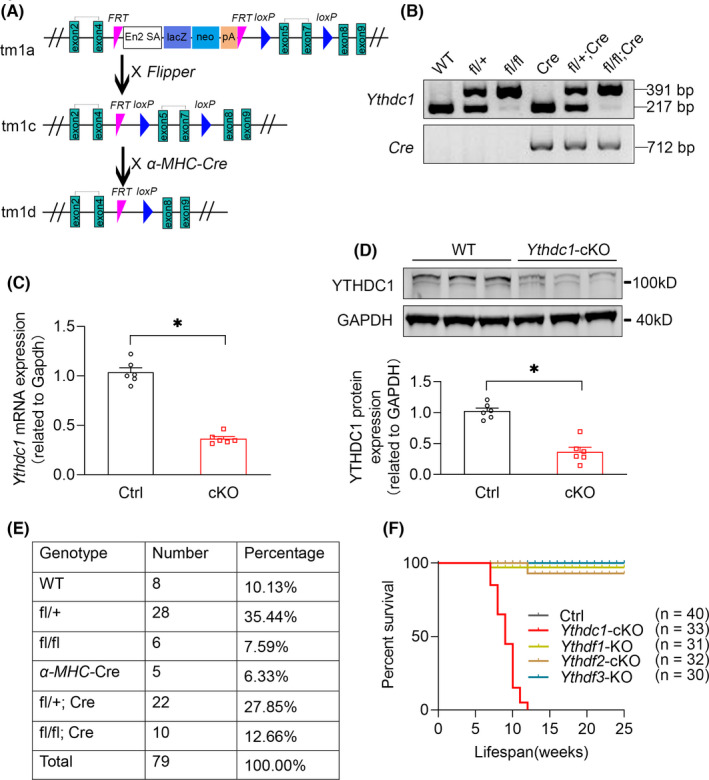
Generation of cardiac‐specific YTHDC1 knockout mice. (A) Schematic diagram represents WT and mutant loci of Ythdc1 gene together with the targeting vector. Exons for the gene encoding Ythdc1 were represented by a green box. Conditional Ythdc1 knockout mice were generated by cross‐breeding Ythdc1 loxP/WT mice with α‐mhc‐cre positive mice. (B) PCR genotyping analysis of Ythdc1 knockout mice. Ythdc1 −/− produced the expected 391 bp mutant fragment compared with a 217 bp wild‐type fragment. (C) qPCR analysis of Ythdc1 expression in WT and Ythdc1‐cKO mice left ventricle. The data are shown as means ±SEM n = 6. * p < 0.01 compared with ctrl by unpaired t test. (D) Typical Western blot analysis of YTHDC1 expression in WT and Ythdc1‐cKO mice left ventricle. The pooled data below are shown as means ±SEM n = 6. *p = 0.014 compared with ctrl by unpaired t test. (E) Viable mice were born at approximately Mendelian ratios. (F) Cumulative survival curve of Ctrl (n = 40), Ythdc1‐cKO (n = 33), Ythdf1‐KO (n = 31), Ythdf2‐cKO (n = 32) and Ythdf3‐KO (n = 30) mice. Data are presented as mean ± SEM
