FIGURE 2.

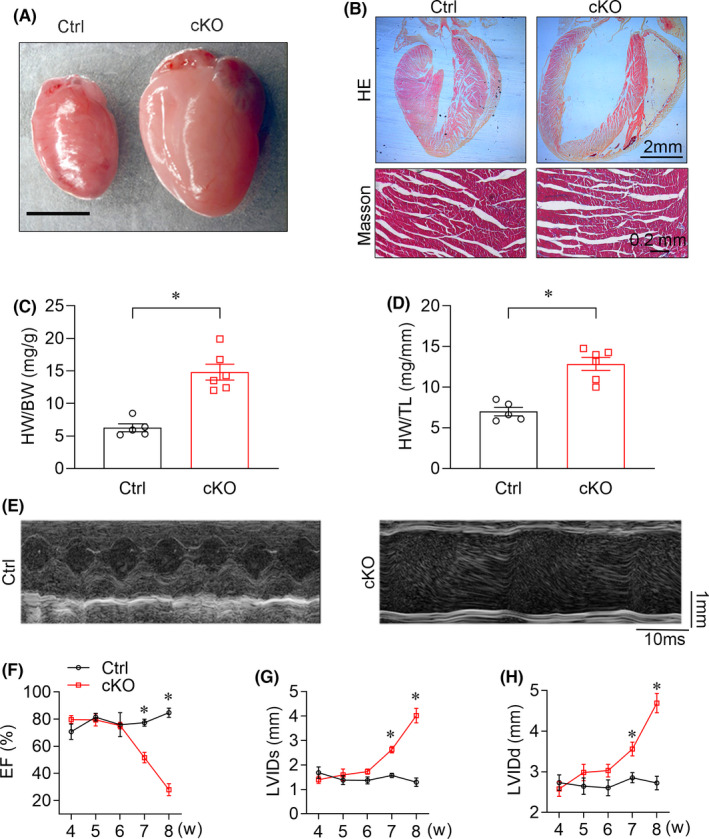
Cardiac‐specific YTHDC1 deletion leads to DCM. (A) Representative microscopic views of Ctrl and Ythdc1‐cKO entire mouse hearts (scale bar: 5 mm). (B) Top, Representative H&E staining of Ctrl and Ythdc1‐cKO heart paraffin‐sections (scale bar: 2 mm). Bottom, Representative Masson staining of Ctrl and Ythdc1‐cKO heart (scale bar: 0.2 mm). (C)–(D) Ratio of HW to BW (*p < 0.001) and HW to TL (* p < 0.001) for control (n = 5) versus cKO (n = 6) mice at 8 weeks of age. The adjusted p‐value was calculated by the unpaired t test. (E) Representative echocardiographic images of Ctrl and cKO mice at 8‐week‐old (scale bar: 1 mm). (F)–(H) Echocardiographic measurements for control and cKO mice of LVEF, LVIDd and LVIDs. (n = 5–6 mice at 4, 5, 6, 7 and 8 weeks of age, the adjusted p‐value was calculated by the repeated‐measures two‐way ANOVA test). Data are represented as the mean ±SEM *p < 0.05. LVEF, left ventricular ejection fraction; LVIDd left ventricular internal diameter at end‐diastole; LVIDs, left ventricular internal diameter at end‐systole
