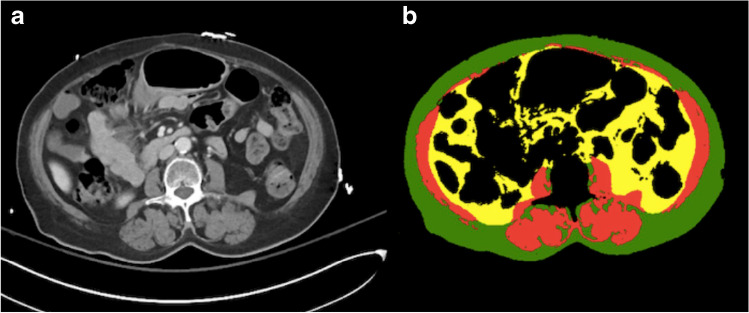
Fig. 1.
a Axial CT imaging slice at L3 vertebral level taken from a CT abdomen-pelvis with b corresponding color-coded total cross-sectional area of the muscle (red), visceral (yellow), and subcutaneous (green) adipose tissue which was determined by the automated machine learning segmentation model developed at our institution

