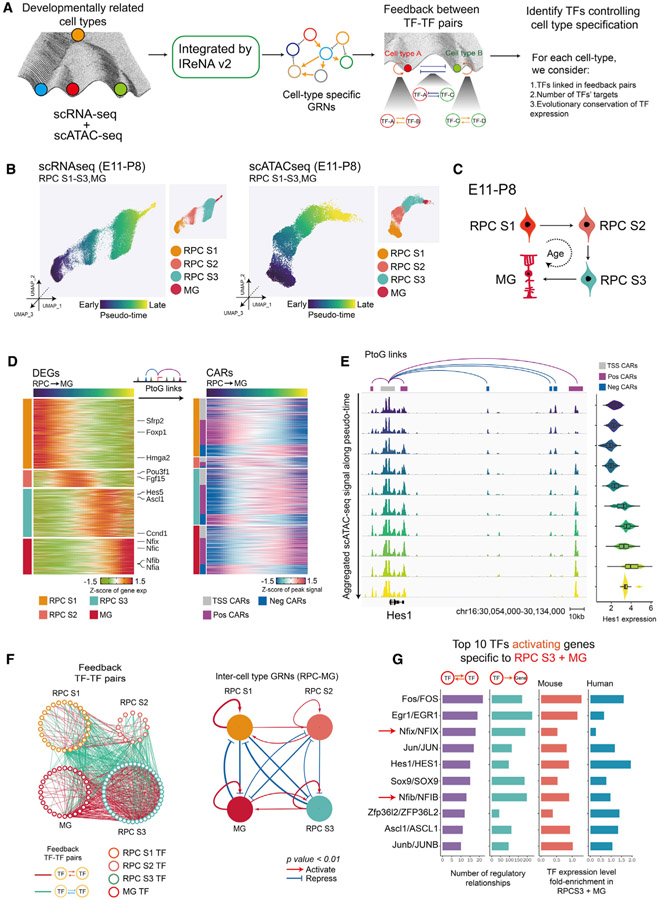
Figure 4. Model of GRNs controlling temporal patterning of retinal progenitors.
(A) Schematic of the analytic pipeline used to identify TFs controlling retinal development. The role of feedback loops (double positive and double negative) in controlling transitions between cell states and during the retinal-cell-fate specification is shown in the Waddington epigenetic landscape model.
(B) UMAPs of retinal progenitors from scRNA-seq (left) and scATAC-seq (right). Cells are colored by pseudotime and cell type.
(C) A model for transitions of primary retinal progenitors and MG during E11-P8.
(D) Heatmaps show expression of cell-type-specific DEGs (left) and their correlated accessible regions (CARs) (right) across pseudotime. The left bar indicates cell types (RPCs S1–S3 and MG) and the classes of CARs (TSS, positively correlated and negatively correlated).
(E) Genome track visualization of the Hes1 locus. Each track represents the aggregated scATAC-seq signals across the RPC-MG trajectory. Inferred links of Hes1-associated CARs (correlated accessible regions) are shown at top. Expression level of Hes1 measured by scRNA-seq across the RPC-MG trajectory is shown at right.
(F) Full network diagram on the left showing TF pairs linked by reciprocal positive or negative regulatory relationships during the RPC-MG transition. Each node represents an individual cell-type-specific TF. Each edge represents a statistically significant feedback relation between TF pairs. Simplified intermodular regulatory networks of retinal progenitors are shown on the right. Colored nodes represent specific cell types. Connections indicate statistically significant regulations among modules. The width of connections indicates their regulatory enrichment fold.
(G) The top 10 TFs predicted to activate expression of genes specific to stage 3 RPCs, as inferred from IReNA v2 analysis (left). Bar plots show expression levels of these TFs in mouse and human stage 3 RPCs progenitors (right).

