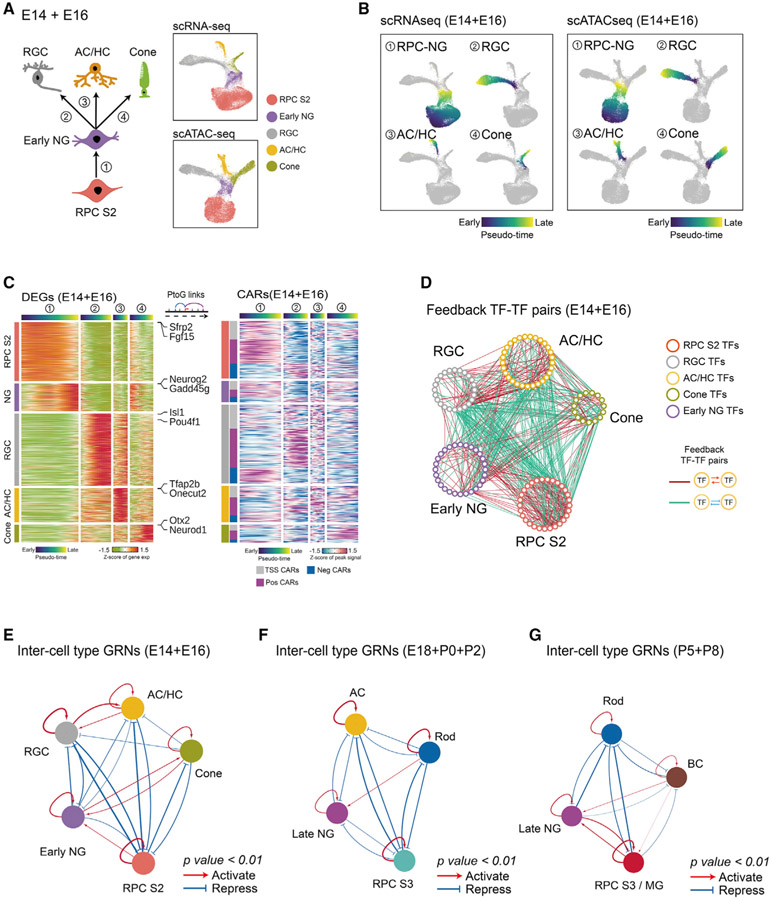
Figure 6. Model of GRNs controlling specification of retinal neuronal cell types.
(A) A diagram showing development of early-born retina cell types (left). UMAPs of scRNA-seq and scATAC-seq data from E14–E16 retina (right) are shown. Color indicates cell type.
(B) UMAPs showing trajectories constructed from scRNA-seq and scATAC-seq at E14–E16. Color indicates pseudotime state.
(C) Heatmaps showing expression of cell-type-specific DEGs (left) and the accessibility of their corresponding CARs (right) along differentiation trajectories. The top bars are colored by pseudotime state for each trajectory. The left bar indicates cell type and the classes of CARs.
(D) Networks showing feedback relationships between TF pairs at E14–E16. Each node represents an individual cell-type-specific TF. Each edge represents a positive- or negative-feedback regulatory relationship between TF pairs.
(E–G) Simplified intermodular GRNs of RPCs and neurons at different stages (E, early-stage; F, intermediate-stage; G, late-stage). Colored nodes represent cell types. Connections indicate statistically significant regulatory relationships among GRNs specific to each cell type. The width of connections indicates their regulatory enrichment fold.

