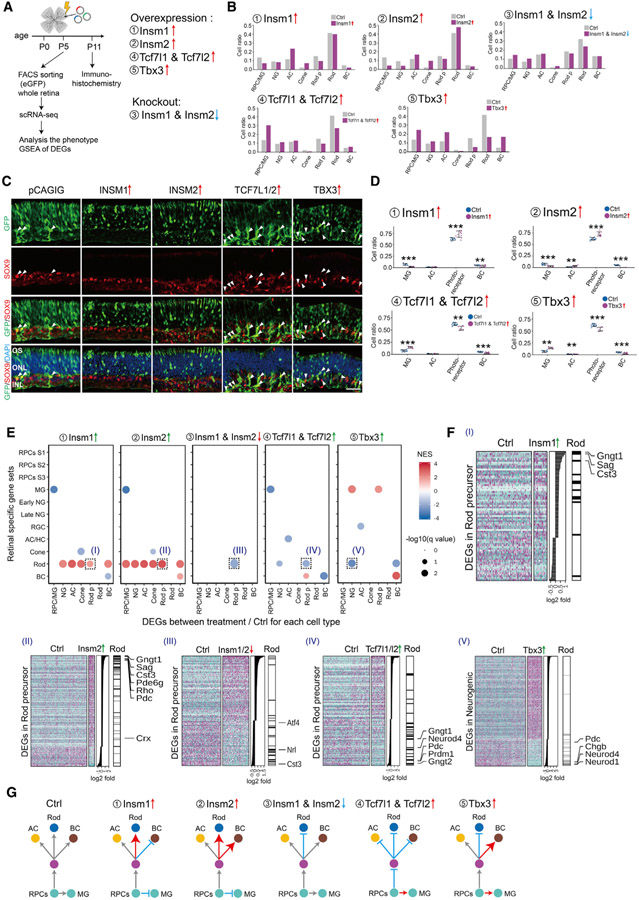
Figure 7. Identification of TFs controlling cell-fate specification in postnatal retina.
(A) A schematic diagram for gain- and loss-of-function analysis of candidate TFs in postnatal mouse retina explants.
(B) Bar plots showing the fraction of each cell type at P5 as measured by scRNA-seq analysis of FACS-isolated GFP-positive cells for each treatment condition.
(C and D) Immunohistochemistry and quantification of MG (SOX9 positive) and photoreceptors (GFP positive in the ONL layer) in P11 retina explants in control and overexpression of INSM1, INSM2, TCF7L1/2, and TBX3. Arrowheads indicate SOX9/GFP double-positive cells. Error bars indicate standard deviation. **p < 0.05; ***p < 0.001; n > 7 retinas/group. Each dot represents a retinal explant. INL, inner nuclear layer; ONL, outer nuclear layer; OS, outer segment. Scale bar represents 30 μm.
(E) GSEA of DEGs from each cell type in each experiment. GSEA was performed with the cell-type-specific gene sets obtained from the combined scRNA-seq data (E11–P8). Only significant enrichment results (p < 0.05) are shown in the dot plot. Each dot was colored by NES and sized by −log(p value). The x axis indicates the cell type where DEGs are calculated. The y axis indicates the specific gene sets used in the analysis.
(F) Examples of GSEA results from (E). Heatmaps show DEGs used in the GSEA analysis, with DEGs ranked by log2 fold change, as shown in the middle panel. The right annotation shows the distribution of significantly enriched gene sets among the DEGs. Representative cell-type-specific genes are also labeled.
(G) Summary of observed phenotypes.

