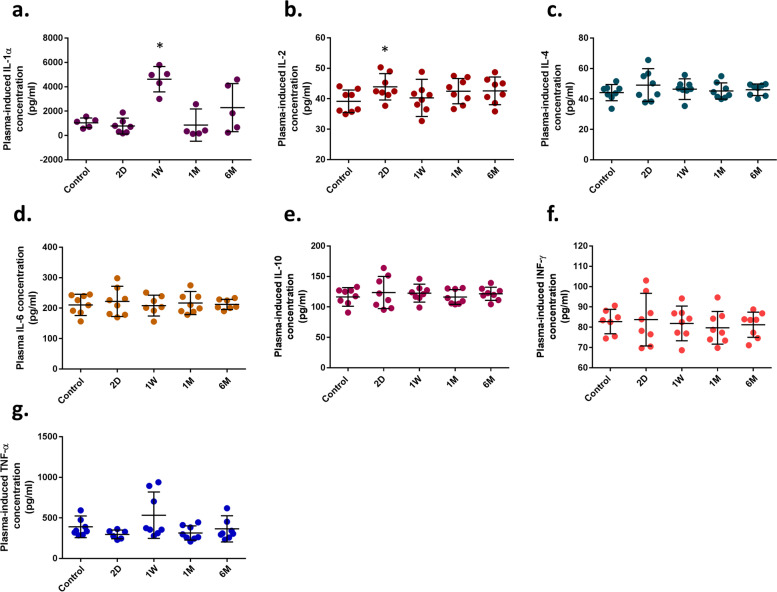
Fig. 2.
Flow cytometry was used to measure the candidate cytokine concentration in tear samples. A there is a significant increase in tear IL-1α concentration (P-value < 0.05) at 1 week (1 W; group B) after ALTP exposure. B The concentration of IL-2 was increased at 2 days (2D; group A) after ALTP-exposure. Comparison between the candidate and control groups showed no significant differences in IL-4 (C), IL-6 (D), IL-10 (E), INF-γ (F), and TNF-α (G). In this figure: an asterisk (*) indicates P-values < 0.05, 2D: 2 days after ALTP-exposure, 1 W: 7 days after ALTP-exposure, 1 M: 1 month after ALTP-exposure, and 6 M: 6 months after ALTP-exposure. The data represent the mean ± SD

