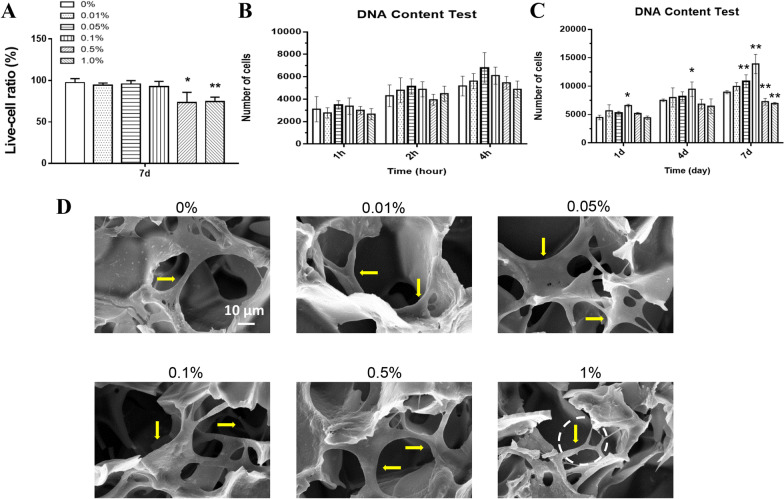
Fig. 4.
a Live cell ratio in live–dead staining results. b Cell adhesion test of USCs adhered to each scaffold using the detection of DNA content. The cross-linked scaffolds containing 0%, 0.01%, 0.05%, 0.1%. 0.5%, and 1% GO were labeled “0%,” “0.01%,” “0.05%,” “0.1%,” “0.5%,” and “1%.” c Cell proliferation test of USCs cultured on each scaffold using the detection of DNA content. d SEM images of USCs adhered to each scaffold after 7 days of culture. Scale bar = 10 µm. Statistically significant differences are indicated with *p < 0.05 and **p < 0.01 versus the 0% group

