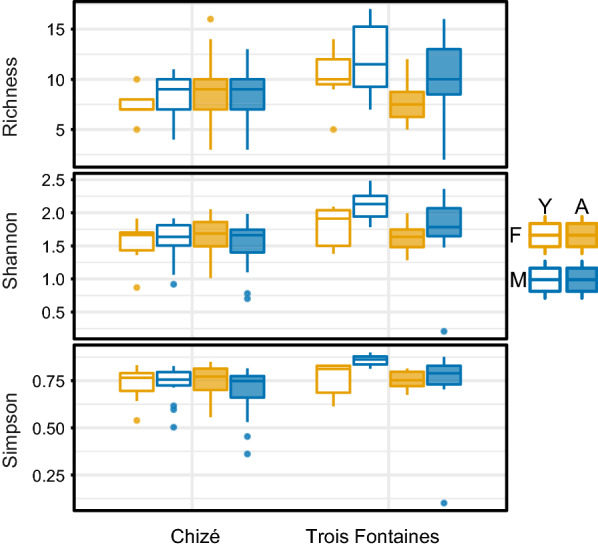
Fig. 3.

Box plot of richness, Shannon and Simpson (1-D) index calculated on ASVs. Each box plot represents the values of alpha diversity index measured by observed ASV in 130 roe deer samples. Each box includes the 25th and 75th percentiles, the median represented by the line within the box, the whiskers indicating the 10th and 90th percentiles, and points above and under each box are outliers. Box plots are distributed based on factors to compare the alpha diversity corresponding to roe deer of different ages (Y: young, A: adult) and sex (M: male, F: female) in Chizé and Trois Fontaines
