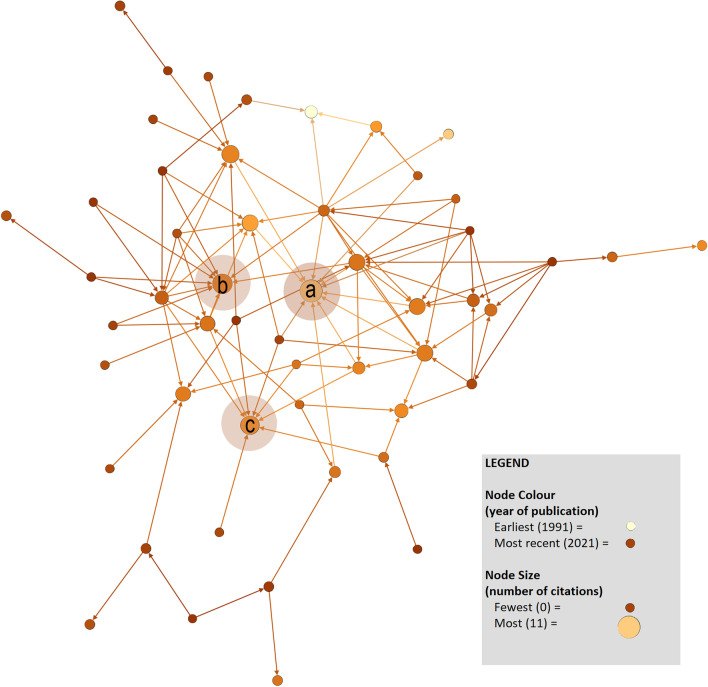
Fig. 2.
Citation network analysis. This network was created using Gephi and depicts the 61 articles in this review (nodes) and citations from a given
source to another within this review represented by a directed arrow (ties). The size and orientation of each node was based on the number of citations an article received, whereas node colours distinguish articles by year of publication. Circles added to the figure denote papers with the highest number of citations, including: a Cooper (1994) (11 citations), b Capella and colleagues (2011) (9 citations), and c Hunt (2007) (7 citations). Note that this network figure only depicts 52 papers because nine papers included in this review had not cited other papers in this review, nor had they been cited by other papers in this review

