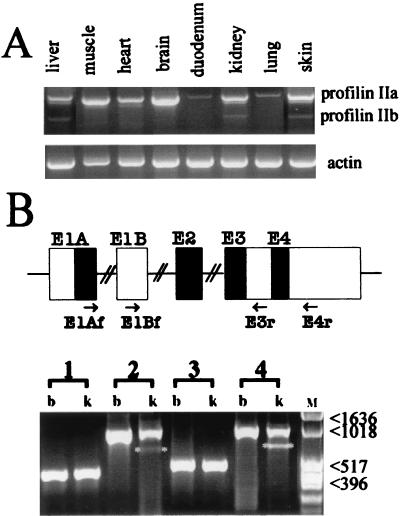
FIG. 2.
Profilin IIa and IIb transcripts in mouse tissues. (A) Quantitative RT-PCR on mRNA isolated from the indicated mouse tissues. The forward and reverse primers used are E1Af and E4r, respectively (see Table 1 for primer sequences and panel B for location). The short PCR product (approximately 690 bp) is an amplification of the profilin IIb mRNA. The longer transcript of approximately 960 bp contains coding information for profilin IIa, a noncoding region, and information for the C-terminal region of profilin IIb (also Fig. 1). β-Actin amplification was used as the control. (B) RT-PCR analysis of alternative spliced transcripts of the mouse profilin II gene (lower panel). First-strand cDNAs prepared from brain (b) and kidney (k) were subjected to PCR using primer combinations E1Af and E3r (lanes 1), E1Af and E4r (lanes 2), E1Bf and E3r (lanes 3), and E1Bf and E4r (lanes 4). Primer sequences are listed in Table 1, and their locations are indicated in the drawing. Profilin II transcripts spliced to exon 3 (corresponding to mRNA-a or -c [Fig. 4]) were detectable as strong bands in both brain and kidney. Transcripts spliced to exon 4 (corresponding to mRNA-b or -d and marked with asterisks) were found weakly expressed in kidney. M, molecular size marker (numbers are in base pairs).

