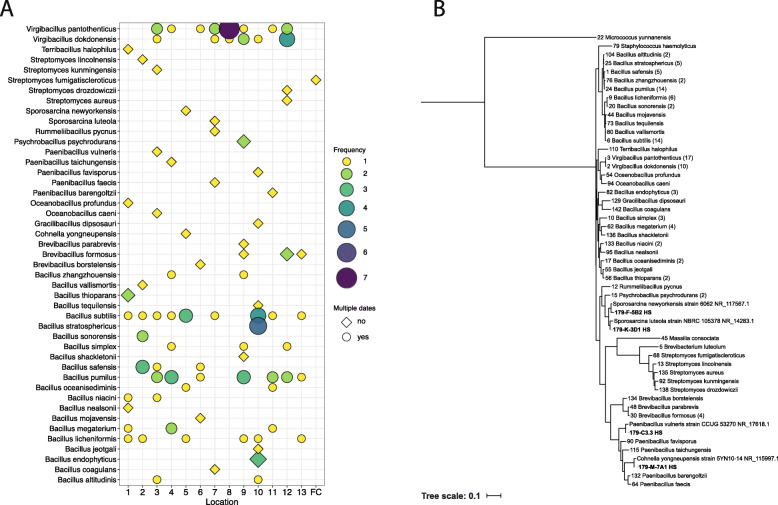
Fig. 2.
Sanger sequencing isolates from the NASA standard assay isolates. A Relative abundance of taxa at each location sampled in SAF. Dot size indicates the number of isolates recovered at a given location, while shape indicates whether an isolate was recovered on one sampling date (diamond) or multiple sampling dates (circle). The color of the dot indicates the number of isolates recovered at each location. C Phylogenetic tree of 16S rRNA genes from Spacecraft Assembly Cleanroom isolates. Numbers in parentheses indicate the number of isolates recovered for each species. Four novel (<98.7% sequence similarity) isolates were recovered (SAF Isolates 59, 66, 97, and 147) and are listed with their closest NCBI hit. The tree is based on maximum likelihood analysis and was constructed using FastTree

