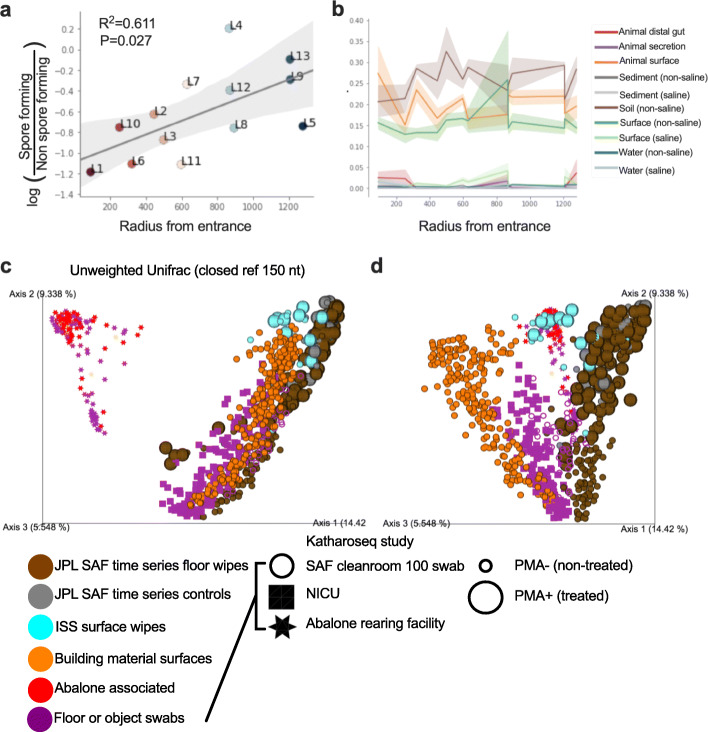
Fig. 4.
Microbial differentiation across SAF locations differs by radial distance from facility entrance (A–B). (x-axes) Linear regression plot of log-ratio of ancestral state predicted sporulating and non-sporulating bacteria (y-axis) by radial distance from entrance (A). Proportion of contribution from AGP and EMP empo-3 sources (y-axis) across radius from entrance (B). Pearson correlation used for linear comparison and error bars represent the standard error of the mean. C Unweighted (C) and weighted (D) microbiome meta-analysis of JPL SAF time series compared to other built environments (JPL SAF 100 swab study, International Space Station, building materials study, abalone rearing facility, NICU hospital study).

